Alation Lineage
Project
I spent a year and a half reimagining Alation’s data lineage experience — transforming it from an unusable, messy visualization into a powerful, Google-Maps-style exploration tool. The goal was to help users navigate complex data flows, understand impact, and make confident, compliant decisions about their data.
Challenge
When I joined the project, lineage had earned itself a dedicated Slack channel called Data Lineage Spaghetti Monsters. The UI was chaotic, performance was slow, and the graph was essentially unreadable. Users couldn’t easily trace where data was coming from or going to, and the experience created more frustration than insight.
Our mission was to design a lineage experience that was fast, clear, and purpose-driven — supporting data discovery, impact analysis, technical debt reduction, regulatory compliance, and manual lineage curation.
My Role & Team
I worked closely with a product manager and engineering lead to:
Audit the existing experience and gather pain points from users
Define core use cases and the “north star” vision for lineage
Translate that vision into phased design deliverables and technical requirements
Duration
1.5 years
Before: Cluttered edges and overlapping lines
Before: Spaghetti monster with limited filters, difficult navigation, and overloaded objects
After: Organized objects by data source, added filters, and metadata layer overlays to contextualize data.
Process & Design Solutions
Setting the Vision
I framed lineage as a “Google Maps for data” — users should be able to say:
“Show me how data moves from this source to this report. Highlight everything in between, and flag any issues along the way.”
This vision became our design compass, guiding all incremental improvements toward a future-state exploratory model.
Supporting Core Use Cases
The design addressed five major user needs:
Data Discovery & Validation – Trace origin, ownership, and trustworthiness of data
Impact Analysis – Predict the ripple effect of changes before they happen
Technical Debt Reduction – Spot inefficiencies and optimize view for performance
Regulatory Compliance – Generate clear, audit-ready lineage diagrams
Manual Lineage Curation – Fill gaps when automated lineage isn’t available
Key Design Improvements
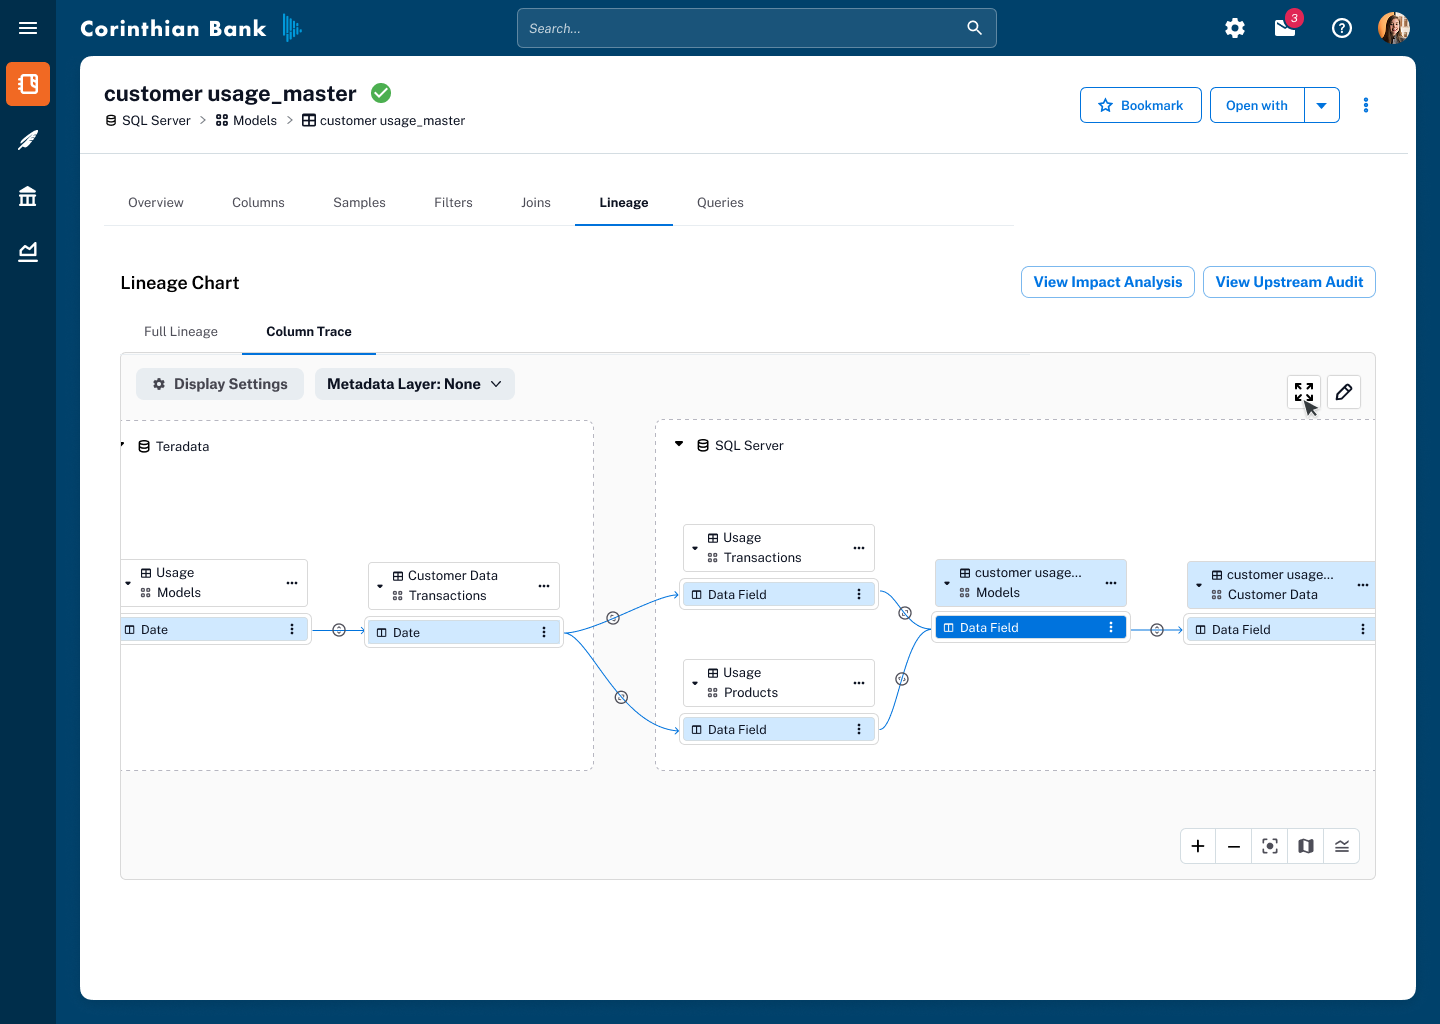
Decluttering the Graph – Combined data flow edges, added mini-map and legend, and moved dataflow details into a side panel to make the chart readable.
Metadata Layer Overlays – Let users add contextual layers (e.g., data quality scores, PII tags, GDPR compliance) directly on top of the lineage graph.
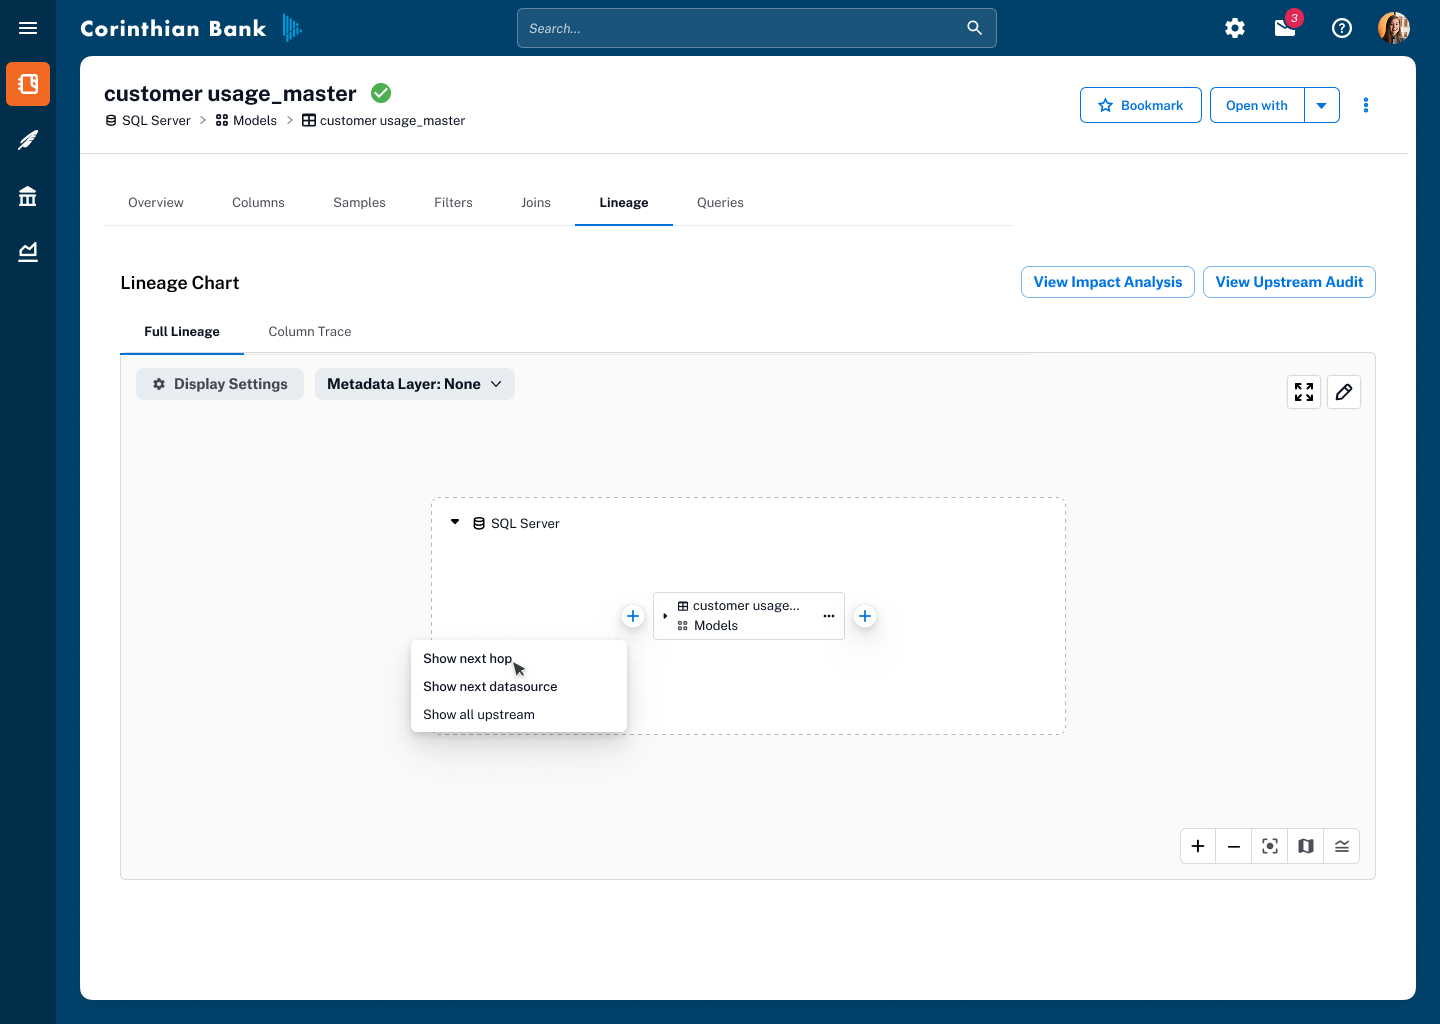
Incremental Loading – Enabled directional exploration (upstream or downstream) with step-by-step expansion to improve performance and focus.
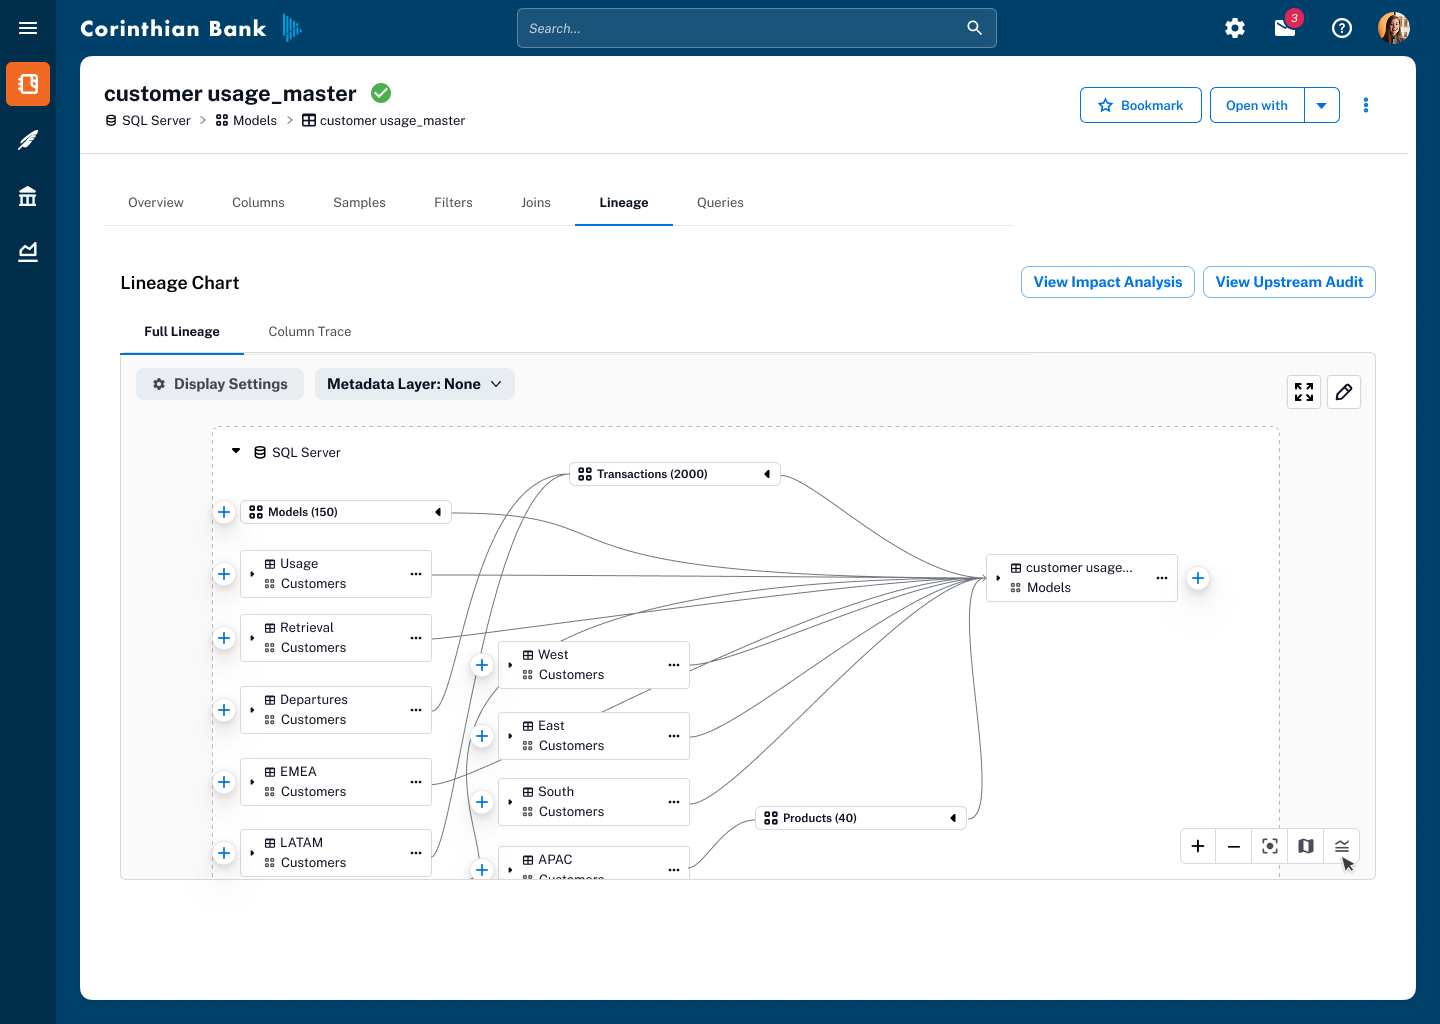
Decluttering and Improving Viewing Port
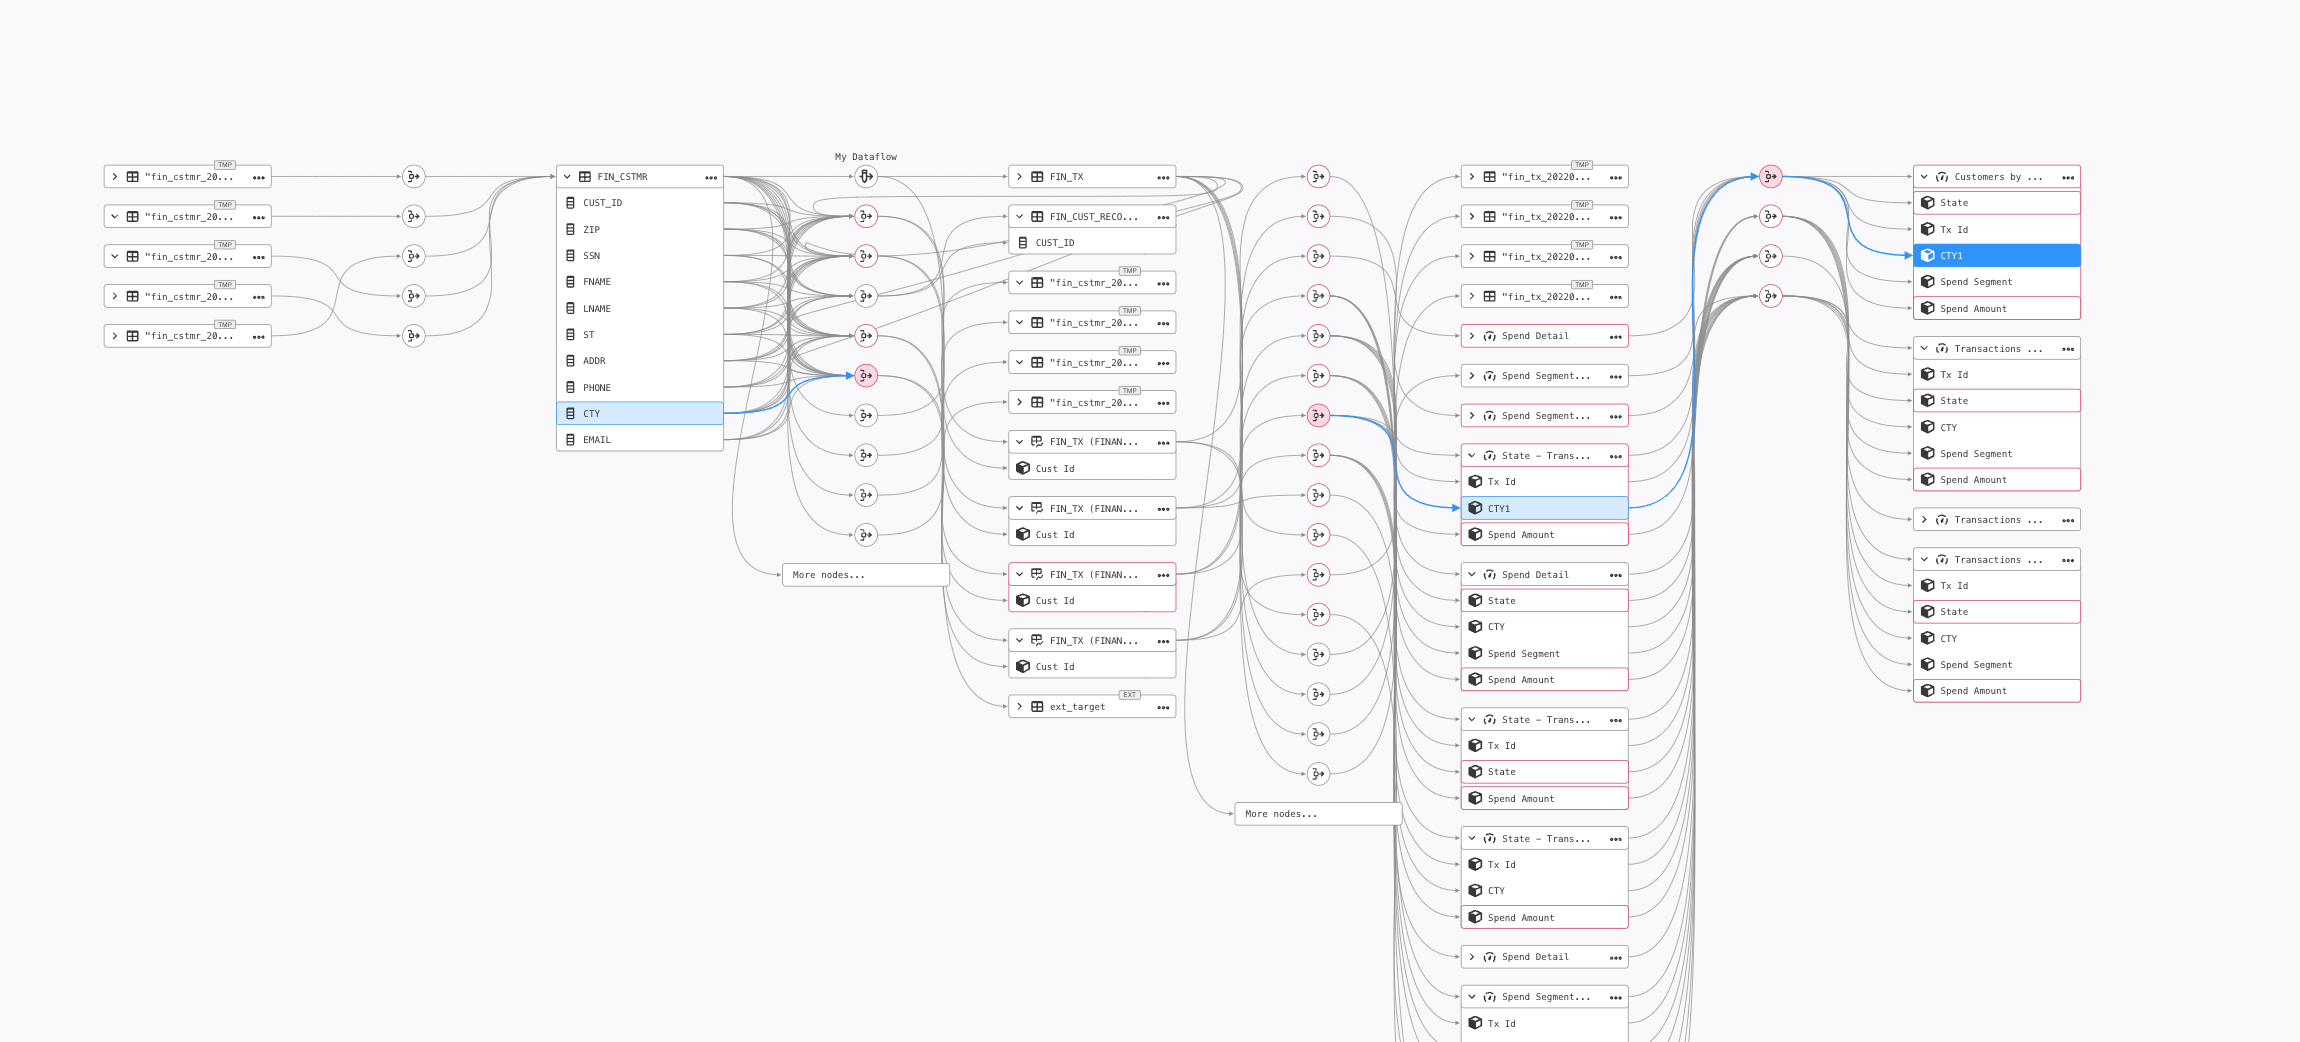
One of the biggest usability challenges in the lineage experience was the overabundance of Data Flow Objects (DFOs)—nodes that represent transformations, joins, and queries. In many cases, these objects flooded the view with repetitive or irrelevant information, including duplicates or even deleted DFOs that no longer provided value. This visual noise made it difficult for users to follow the meaningful flow of data between sources, transformations, and destinations.
To address this, I ran low-fidelity design experiments exploring different ways to show and hide DFOs without losing important context. I tested these prototypes directly with end users, focusing on methods that balanced clarity with quick access to detail.
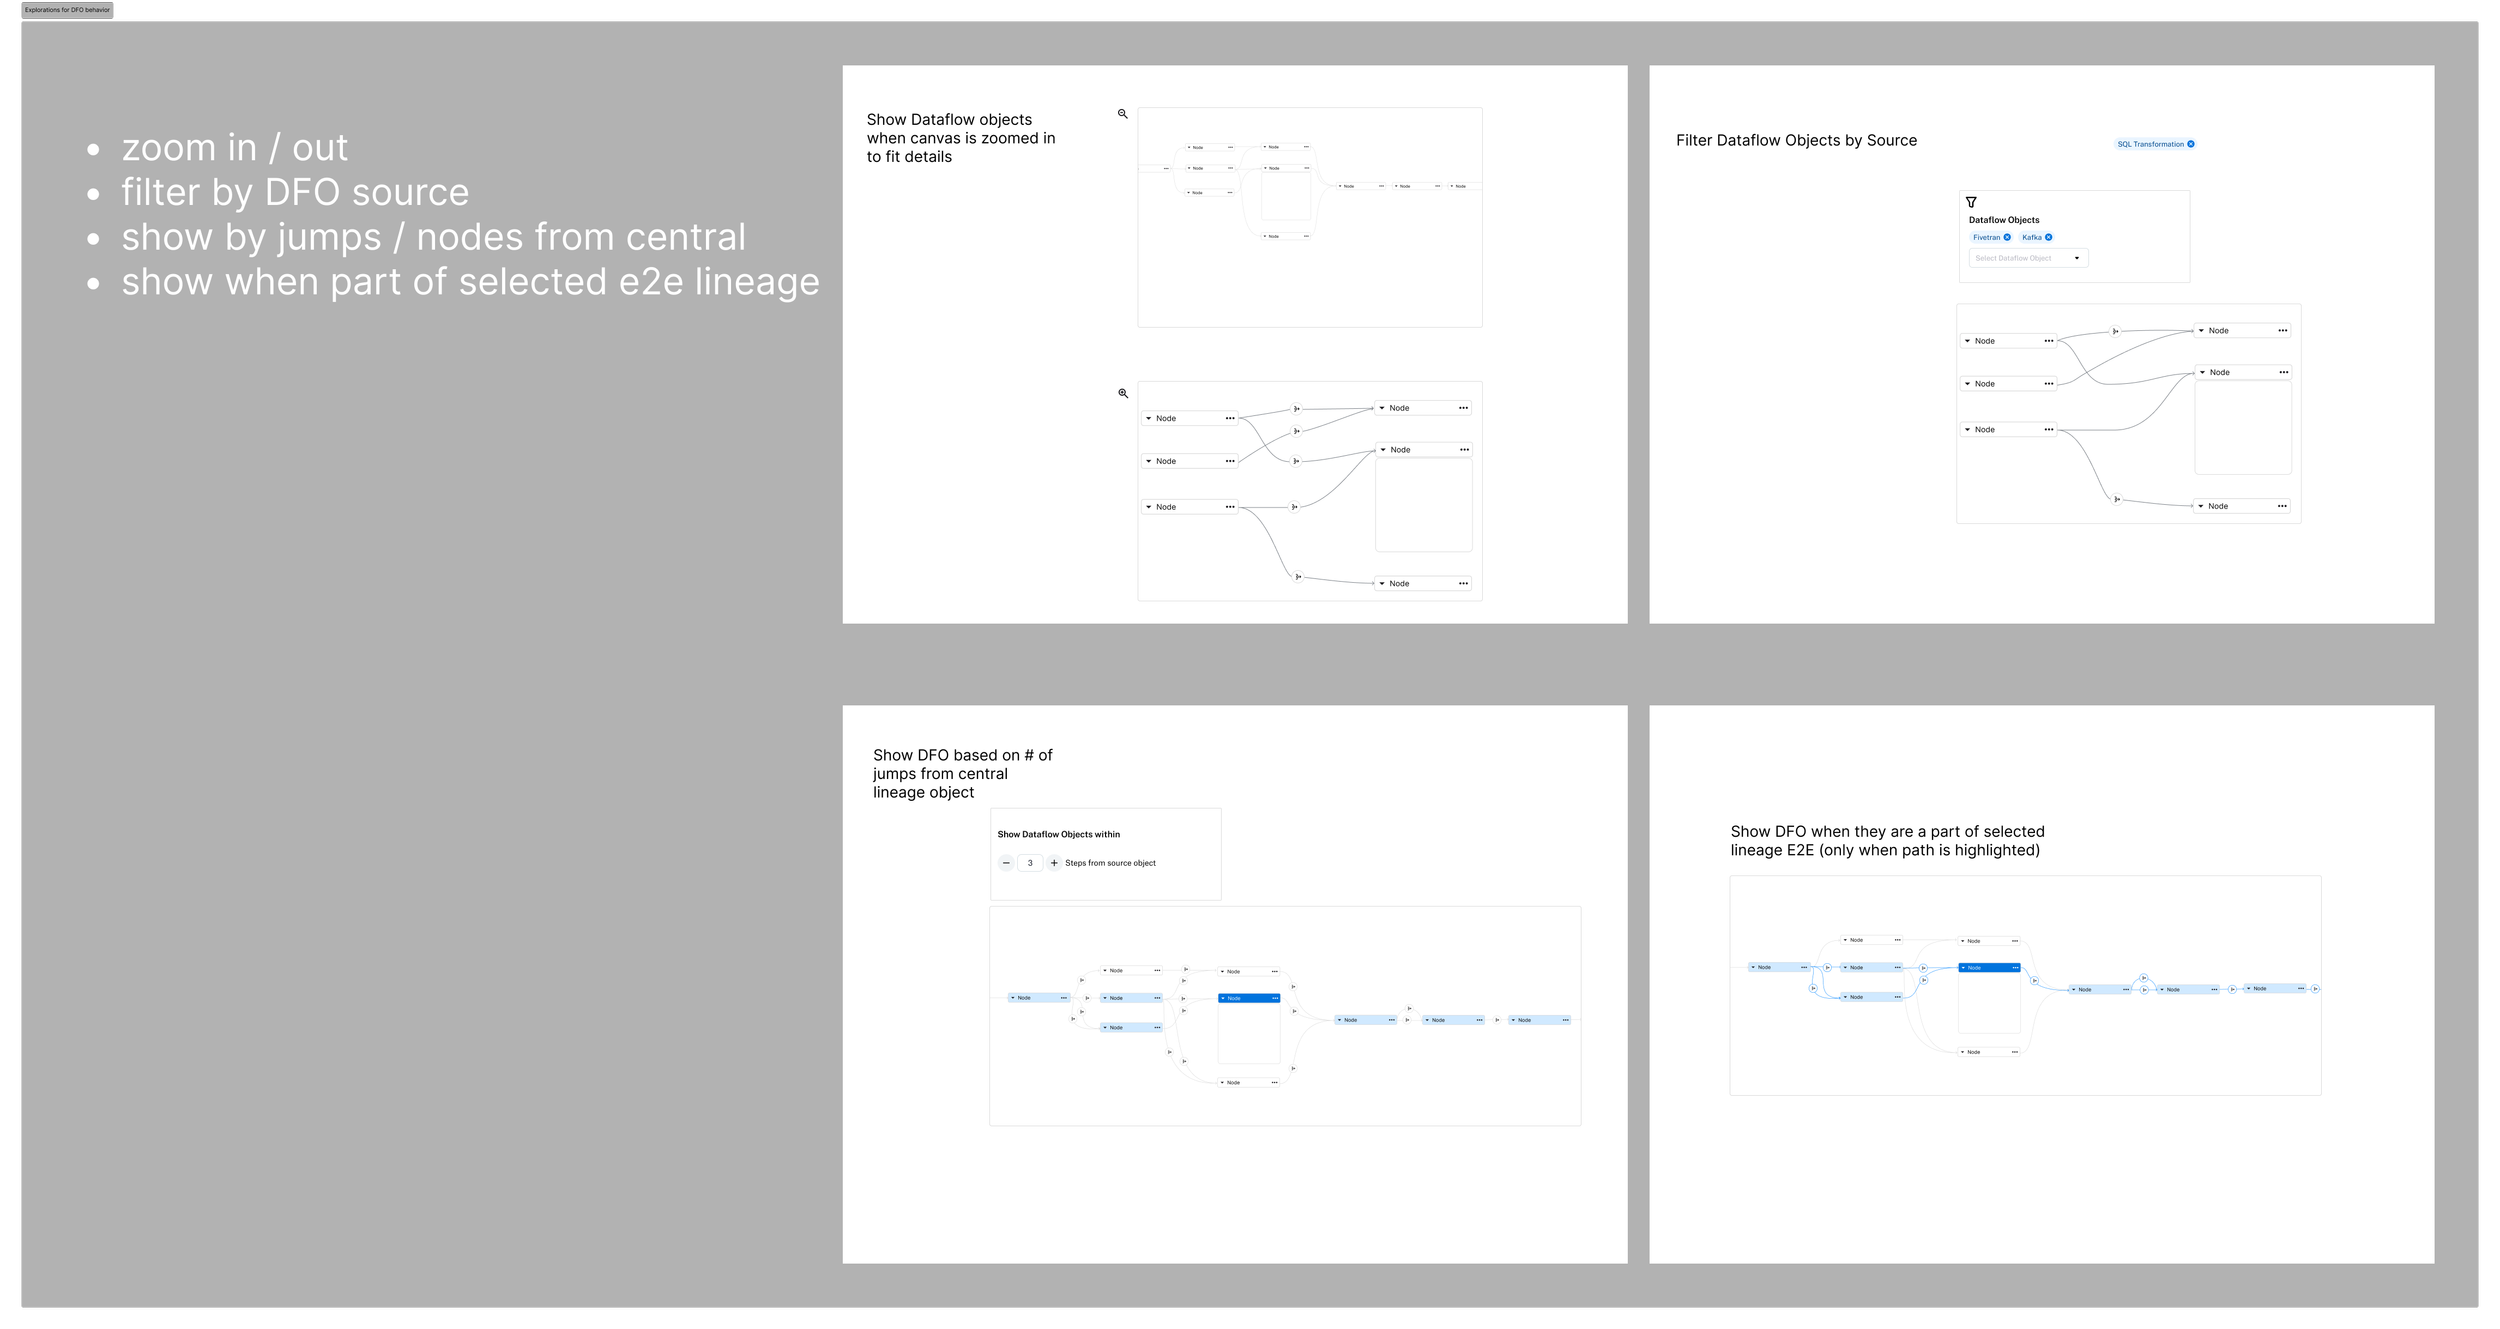
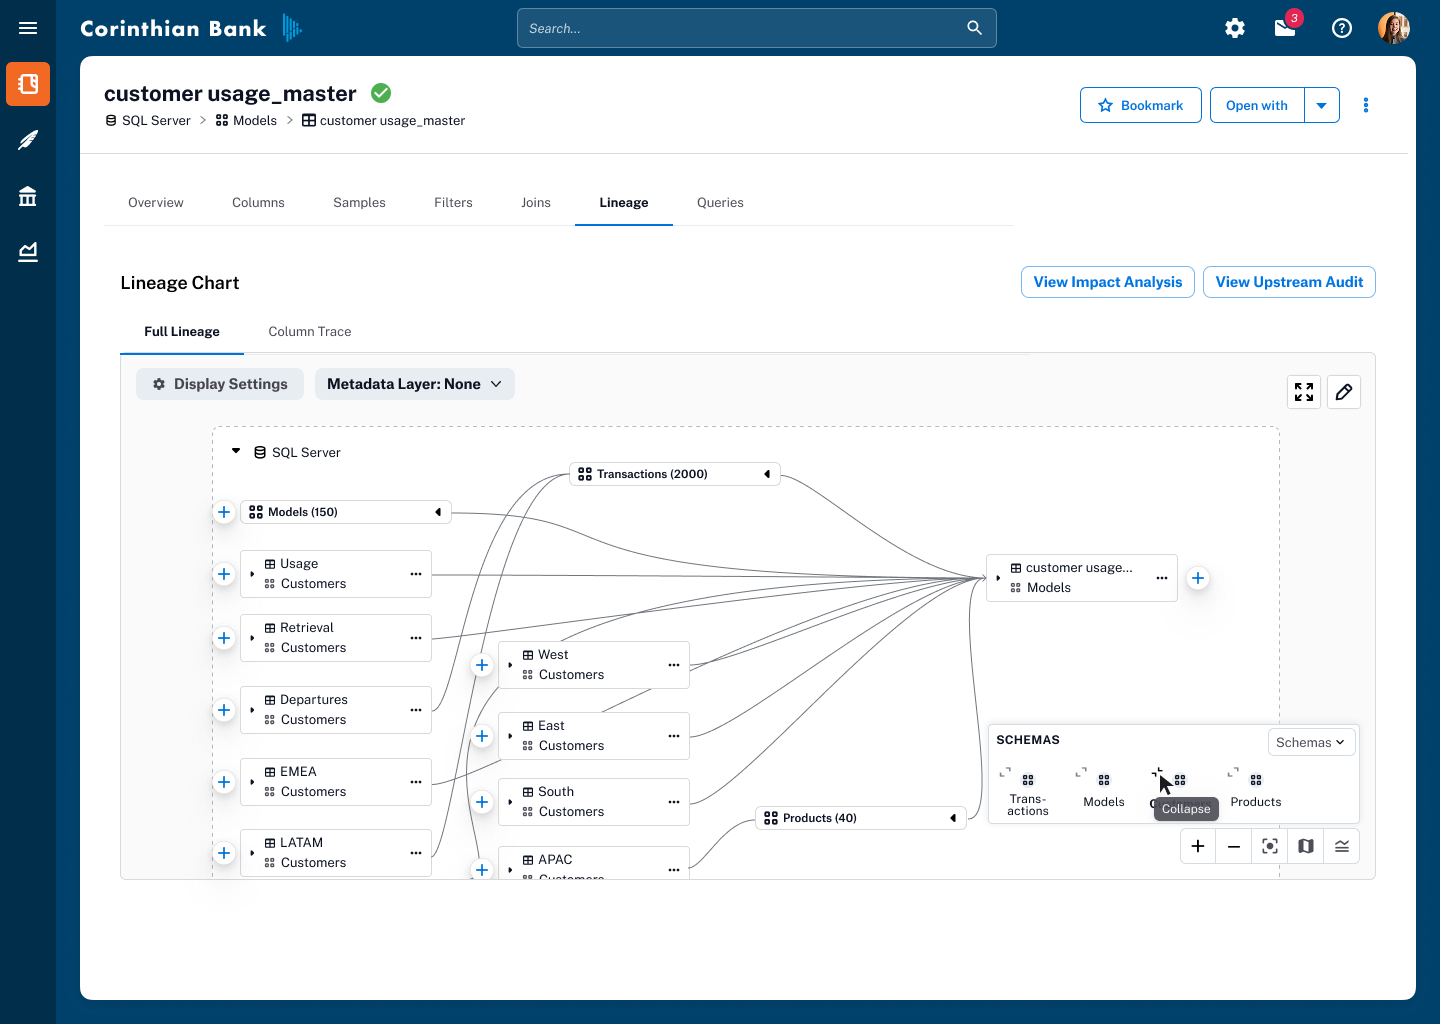
Low-fi Testing
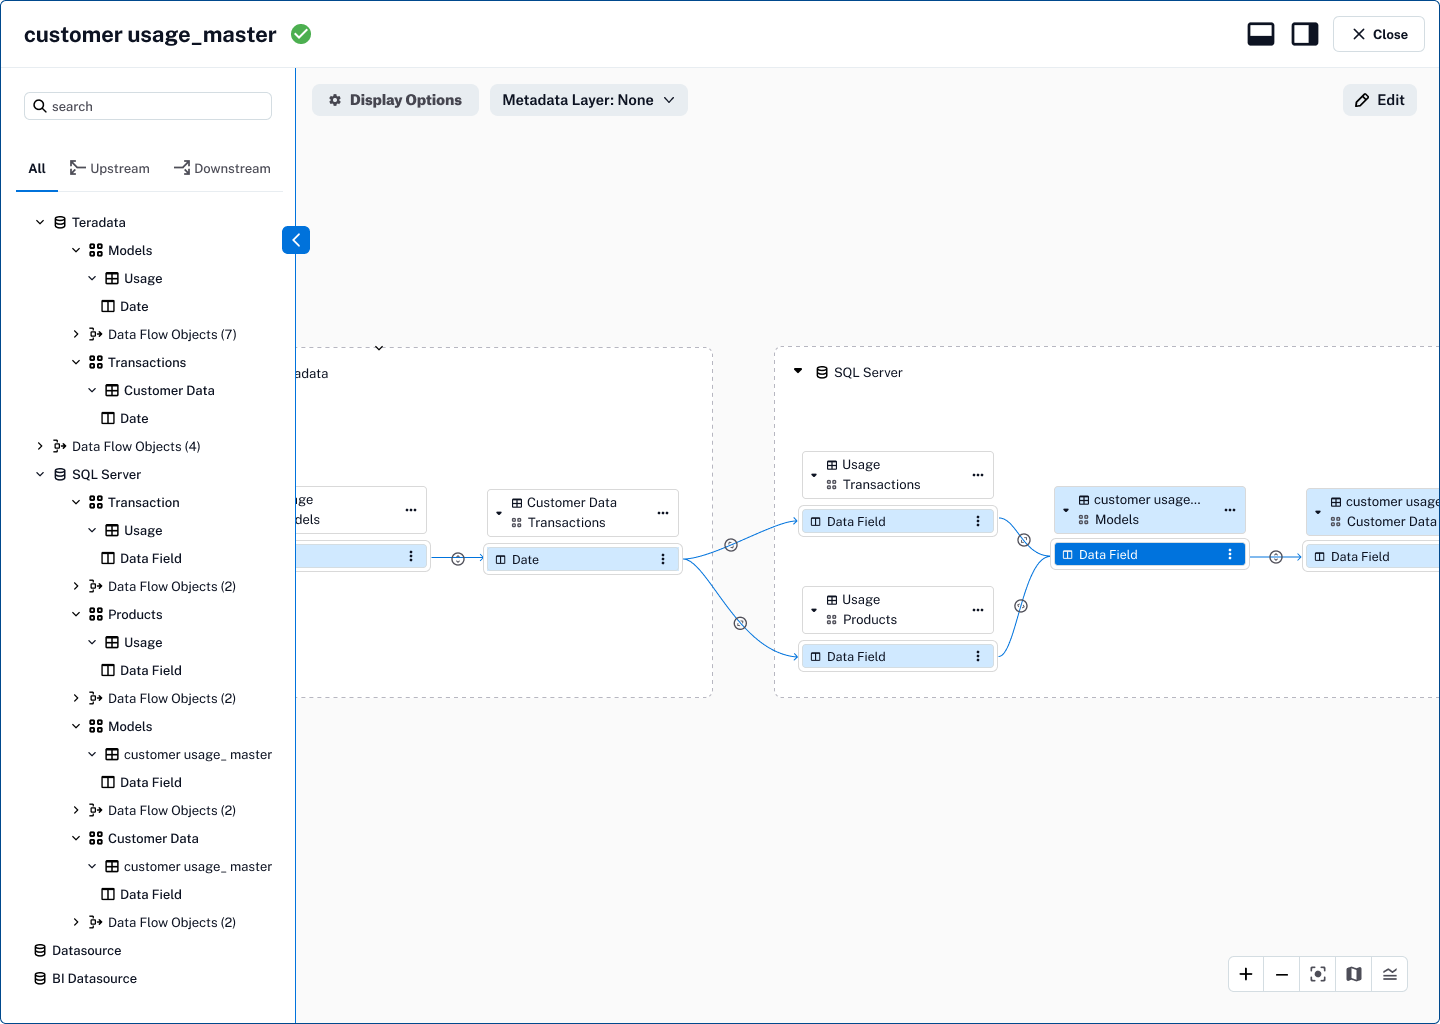
The preferred solution was to collapse all DFOs into a single streamlined edge, using a dedicated icon to indicate their presence. Users could click the icon to expand the underlying transformations on demand, allowing them to explore deeper when needed while keeping the default view clean, focused, and scannable. This approach not only reduced clutter but also improved performance by simplifying what the viewport had to render on load.
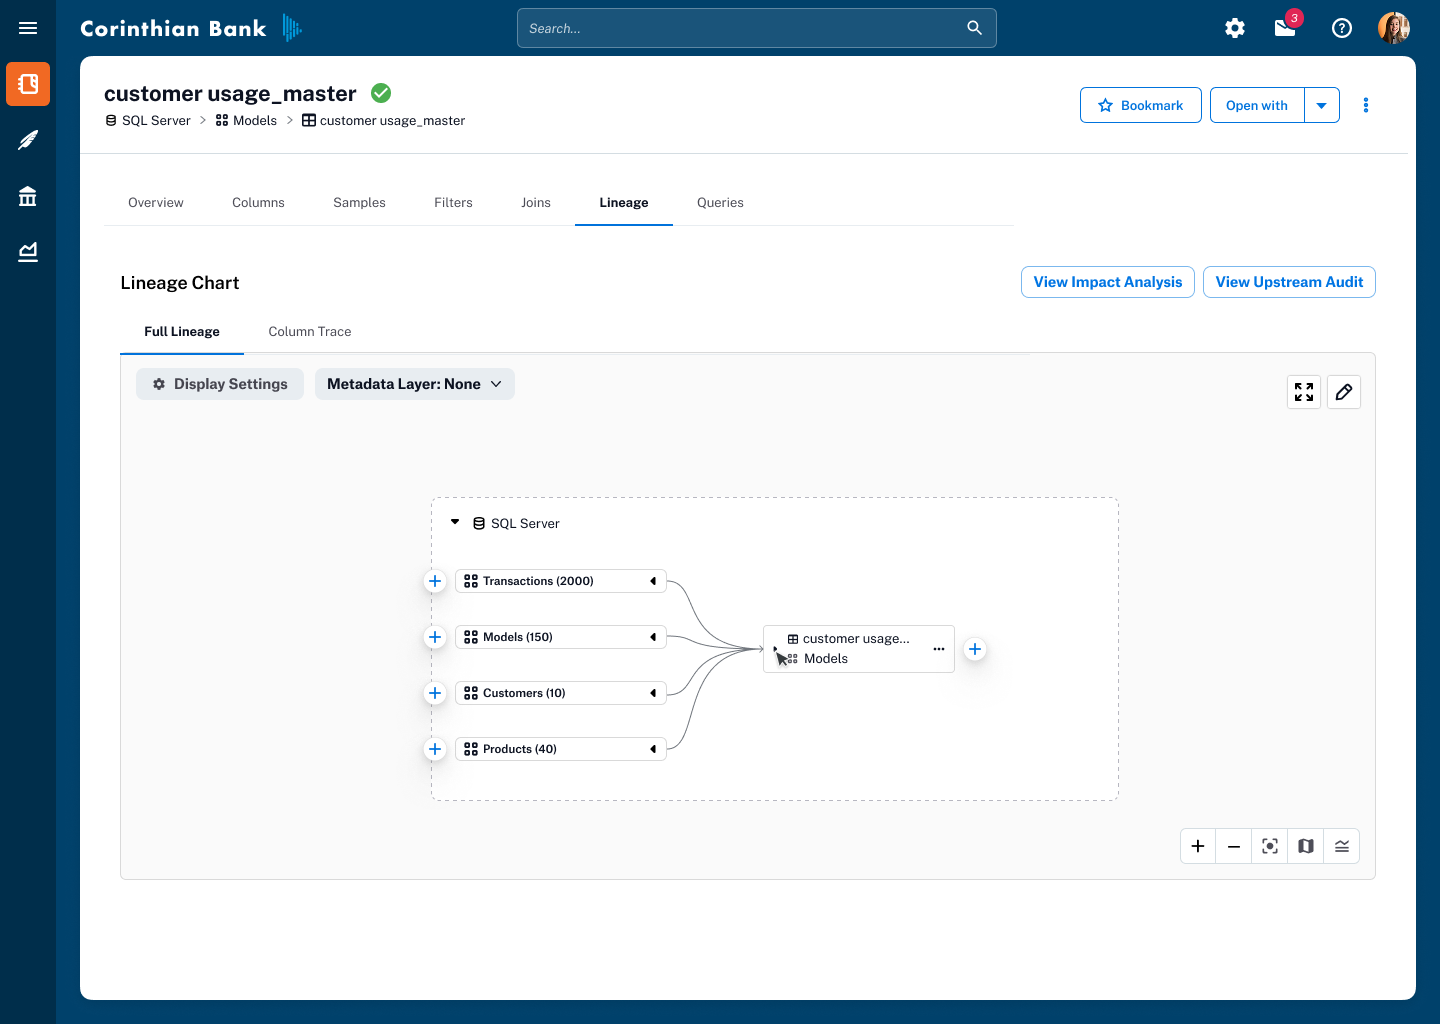
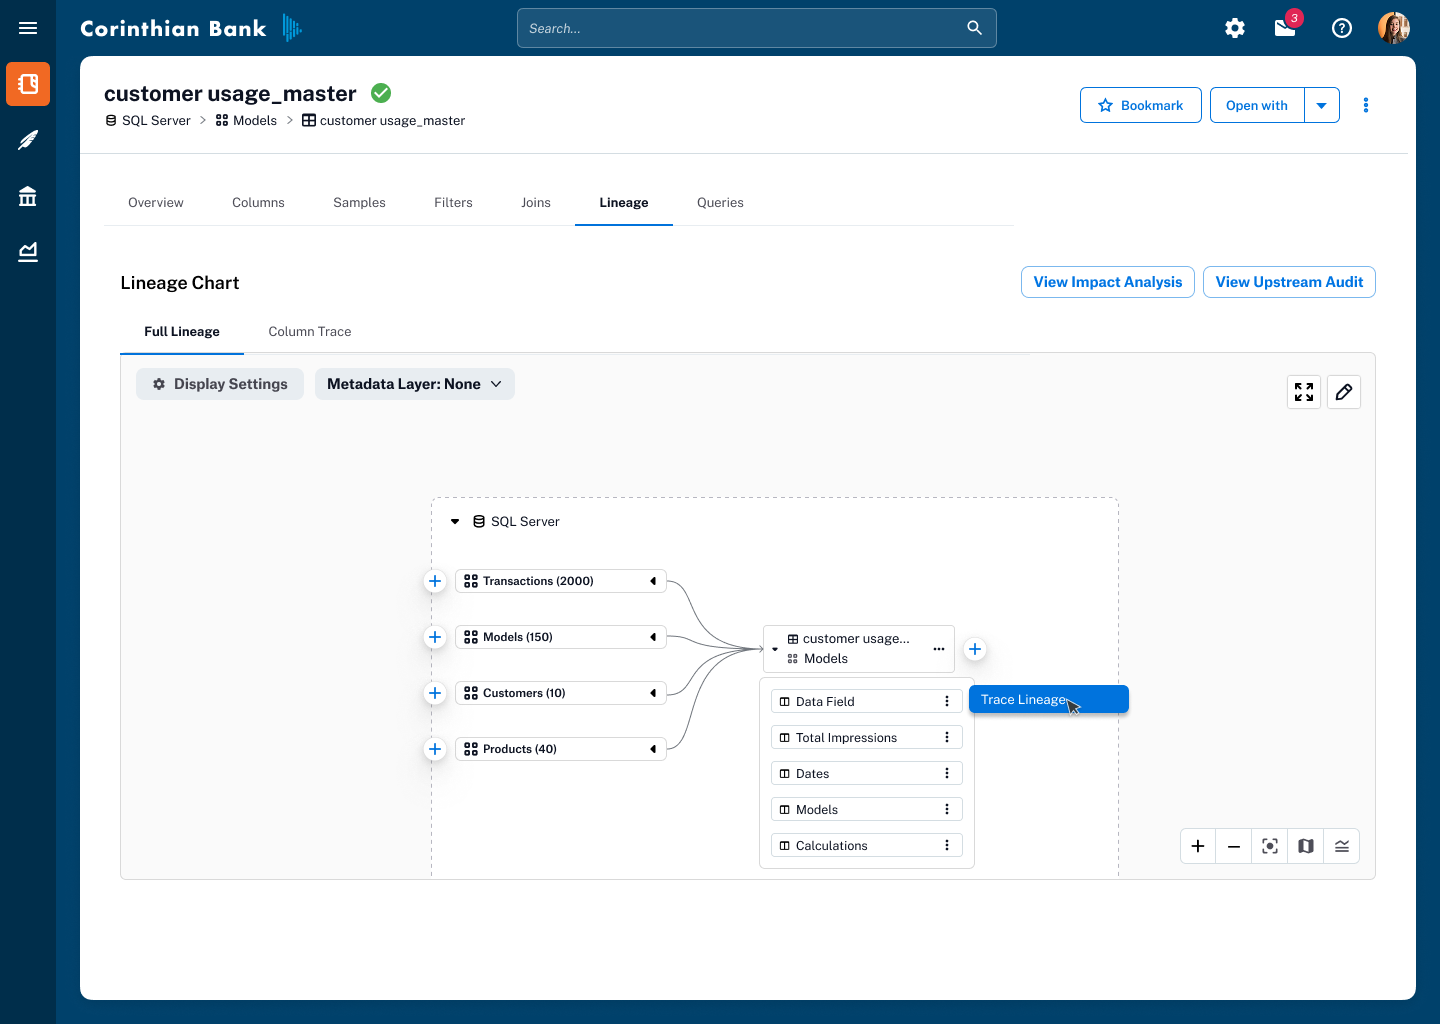
Collapsible DFOs
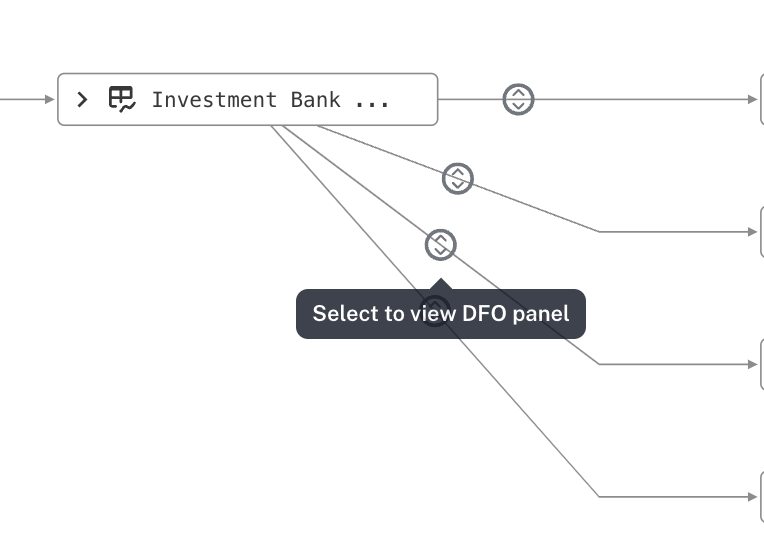
Designs for DFO viewing
Introduced an always-available legend to help users quickly interpret object types and trust statuses at a glance, improving scanability and reducing onboarding friction.
Added a collapsible mini-map to make navigating massive lineage graphs intuitive, while giving users context of their current position in the overall data flow.
Metadata Layer Overlays
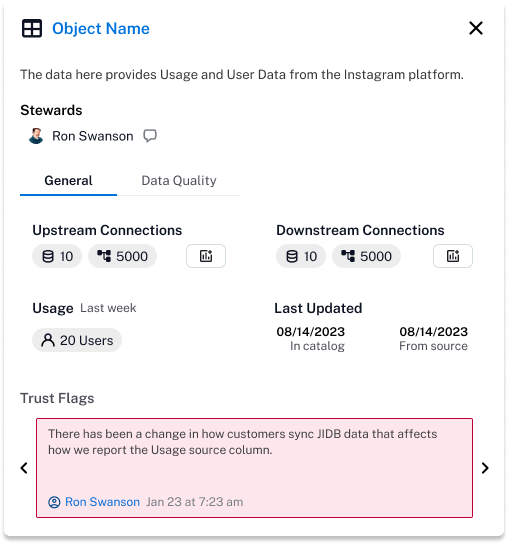
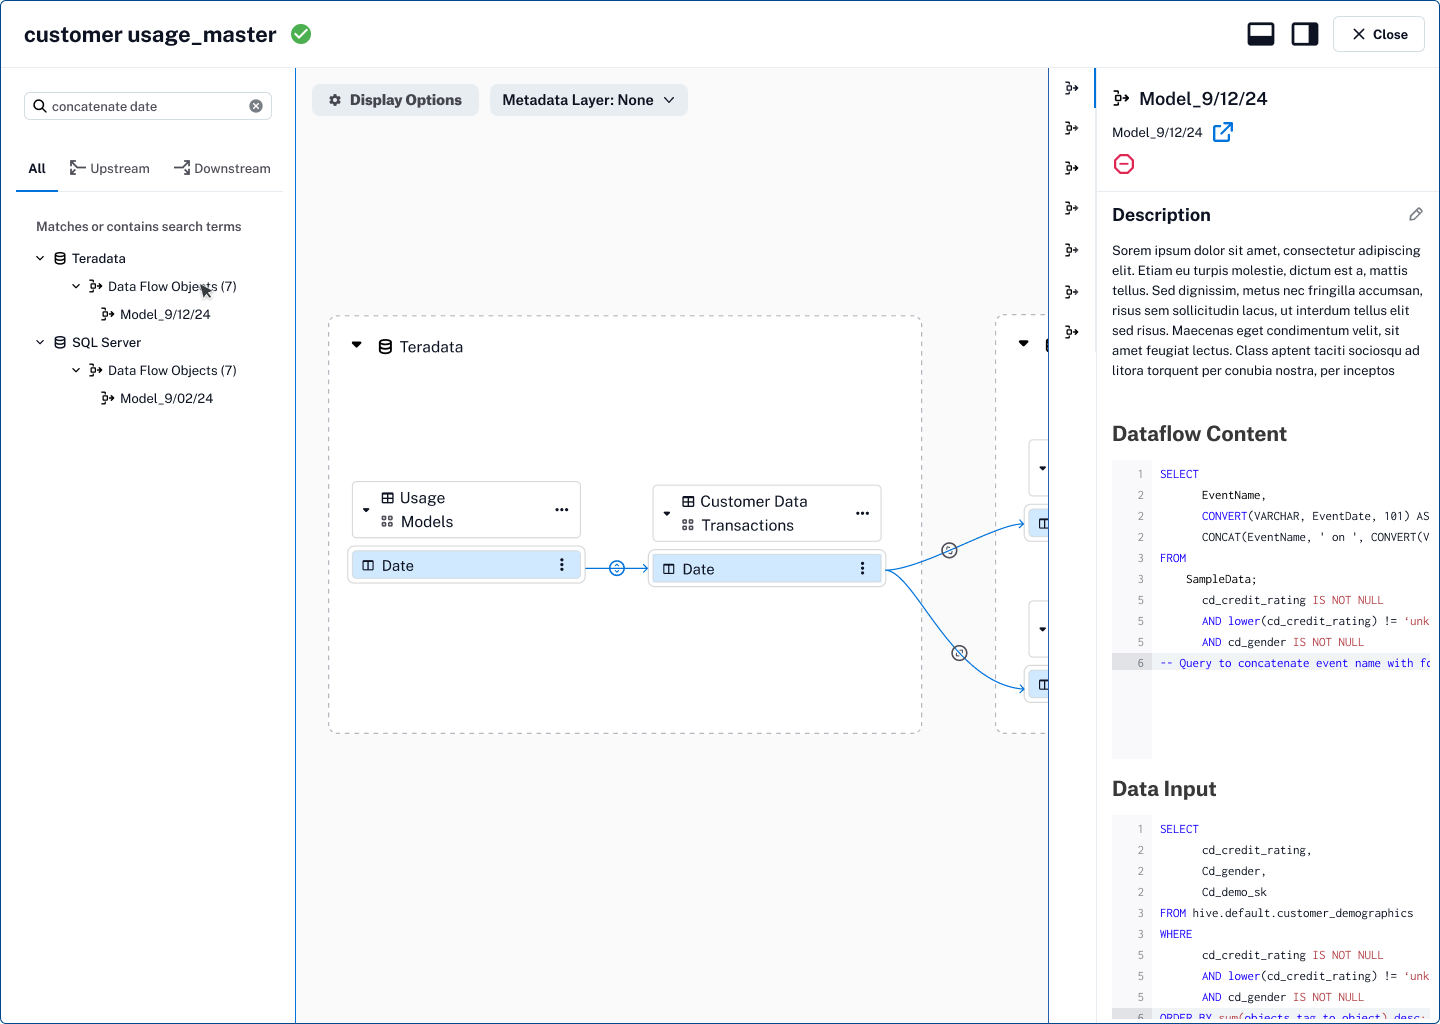
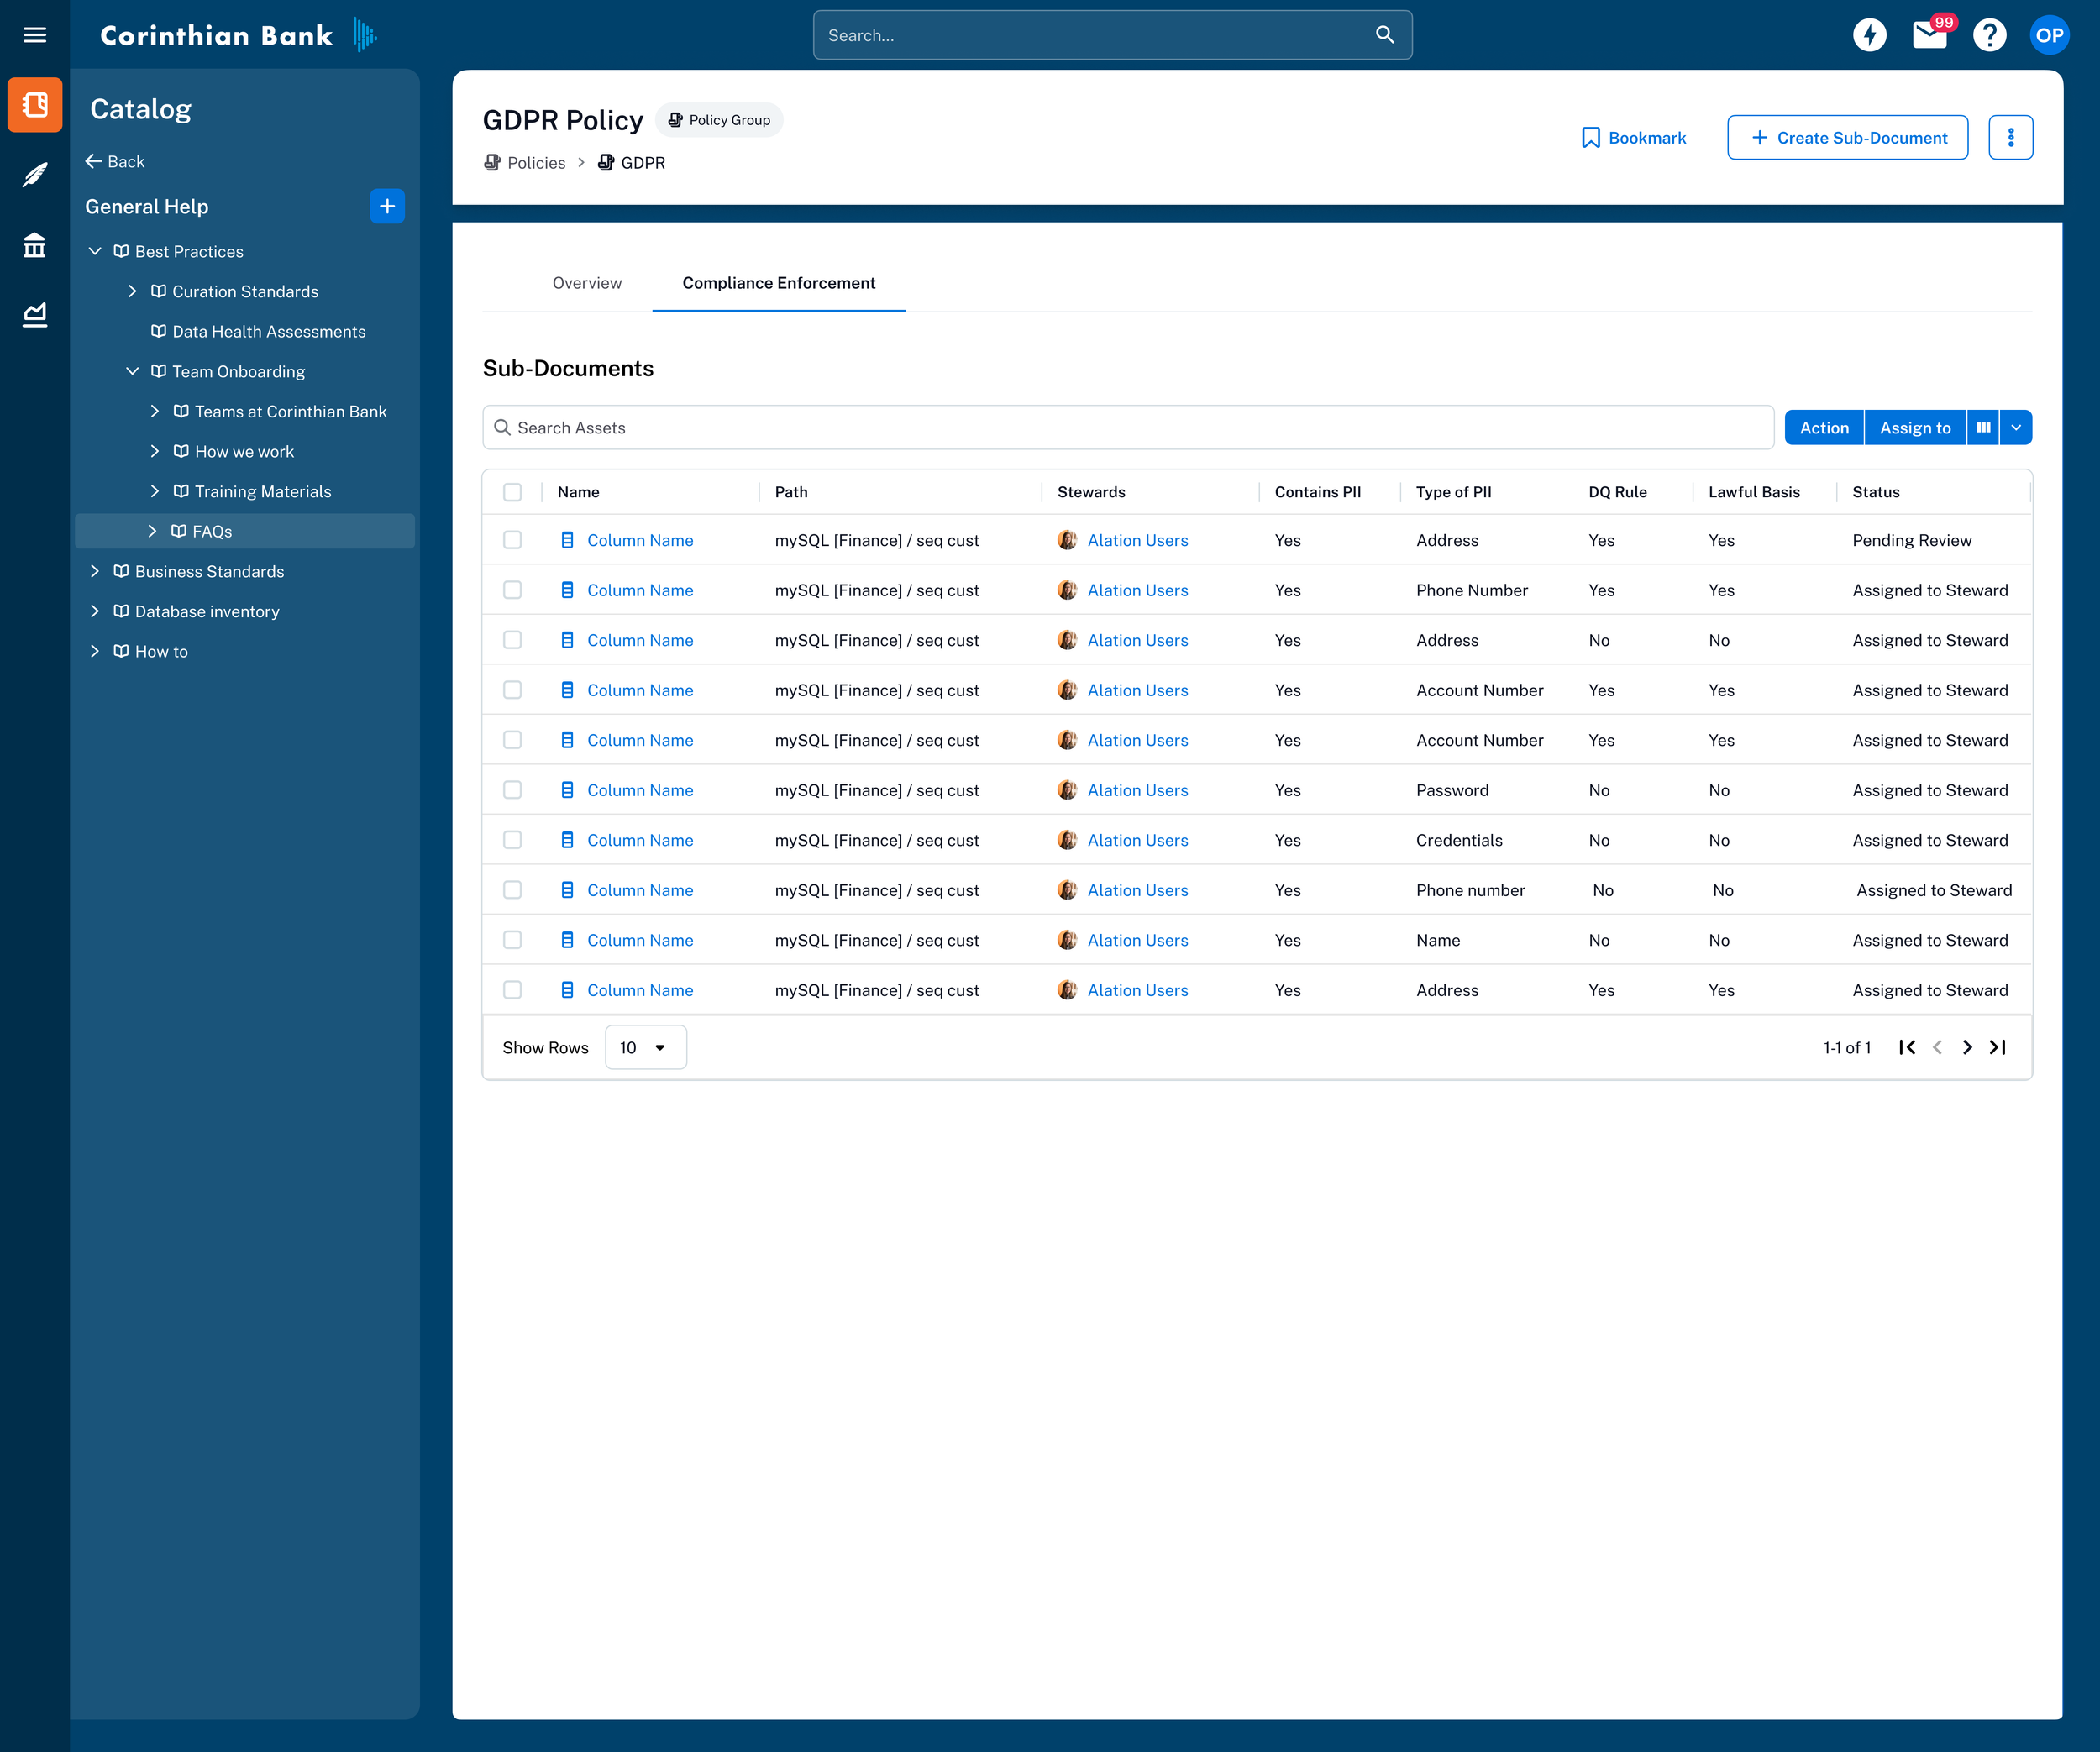
To help users make informed decisions directly from the lineage view, I designed a metadata overlay system that adds critical context without overwhelming the visualization. This layer surfaces trust flags (endorsed, deprecated, warning), custom fields (e.g., PII, GDPR, or any user-defined tags in Alation), and data quality indicators directly on lineage nodes.
Users can click an object to open a concise popover with deeper metadata and relevant details—eliminating the need to leave the graph for context. By surfacing this information in-line rather than in a separate panel, we reduced cognitive load, kept users oriented within the data flow, and made lineage not just a map of data movement, but a context-rich decision-making tool for validation, compliance, and troubleshooting.
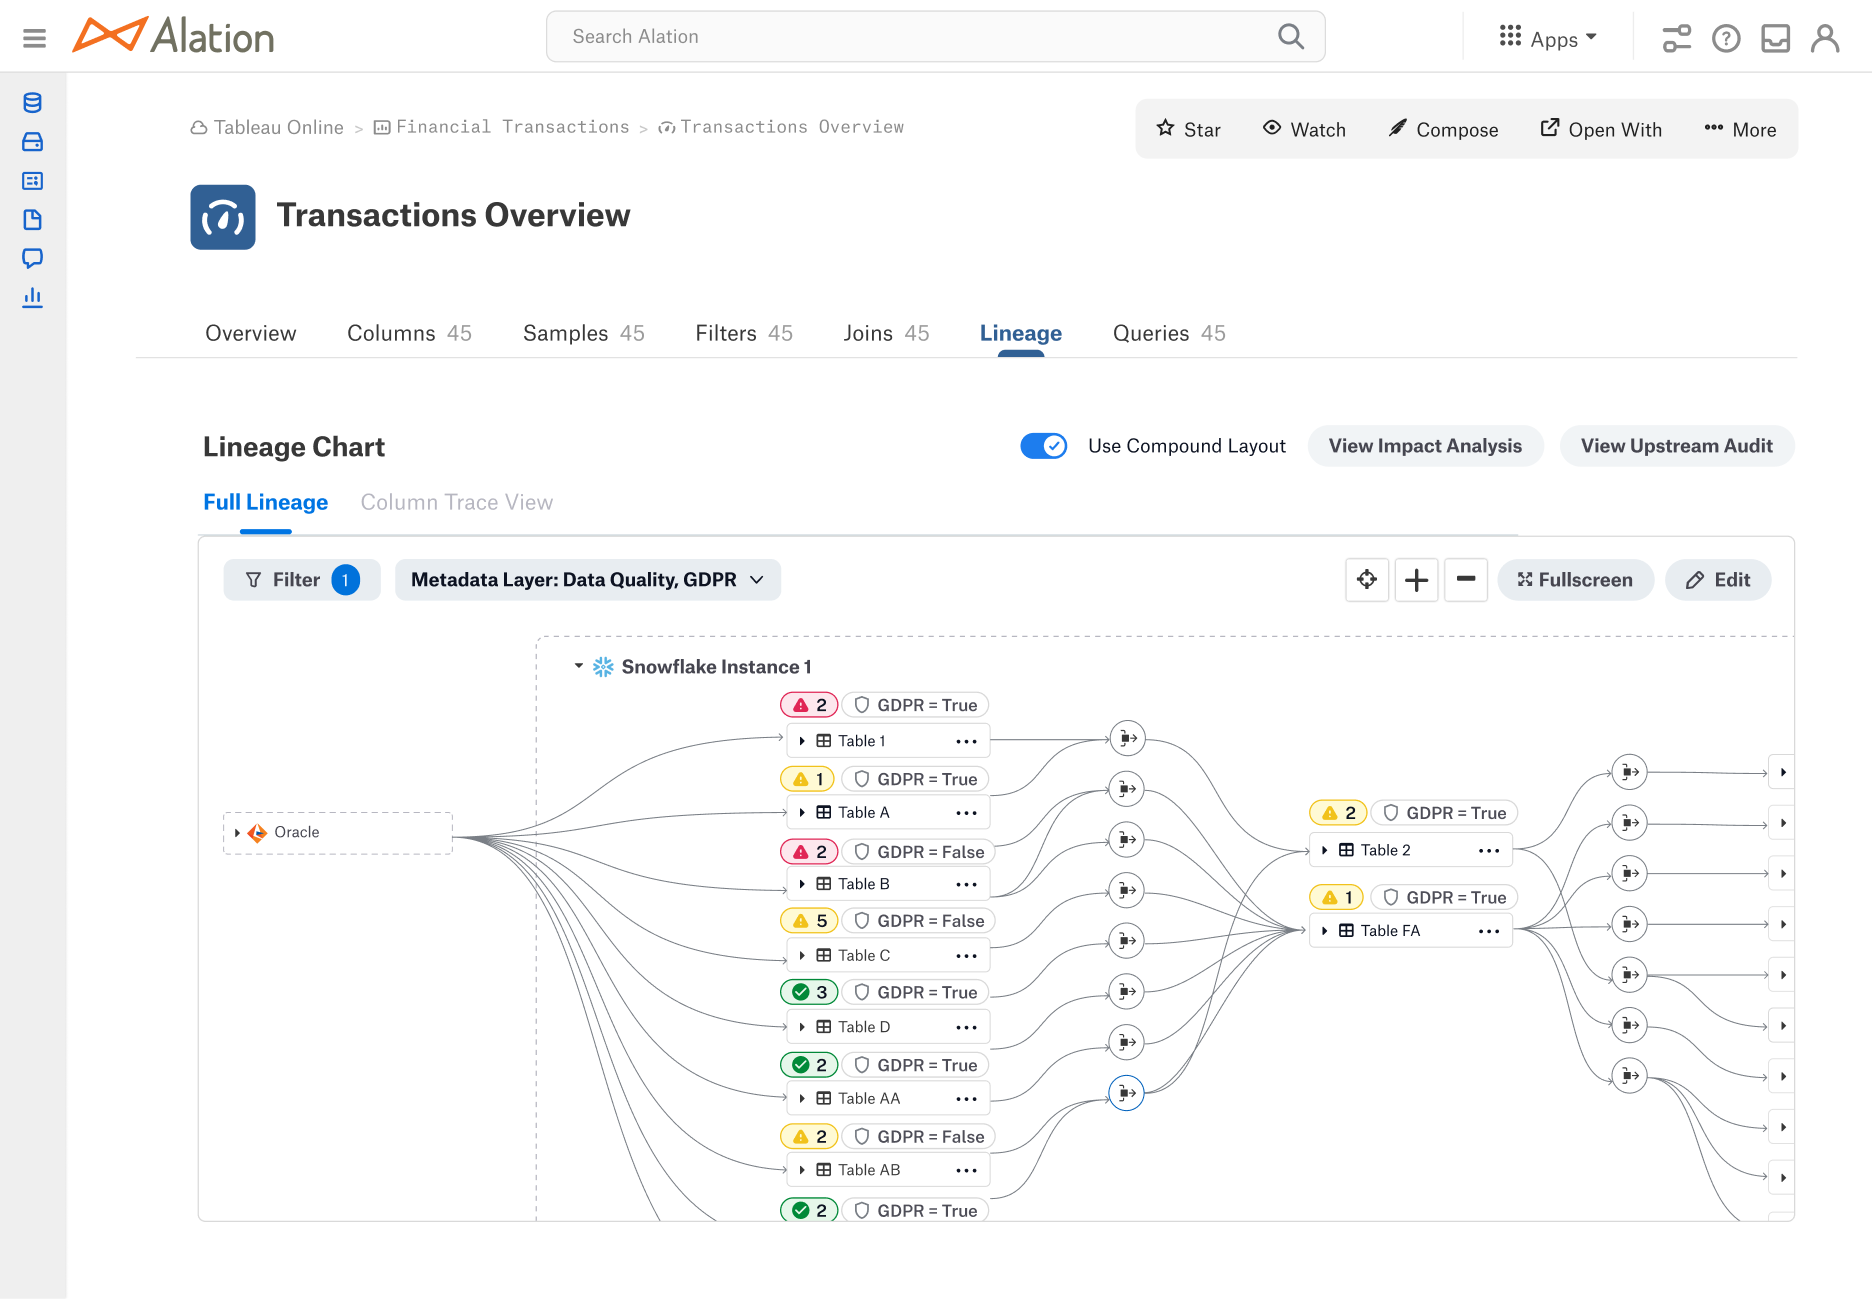
Metadata chips to show status of data quality and custom field “GDPR”
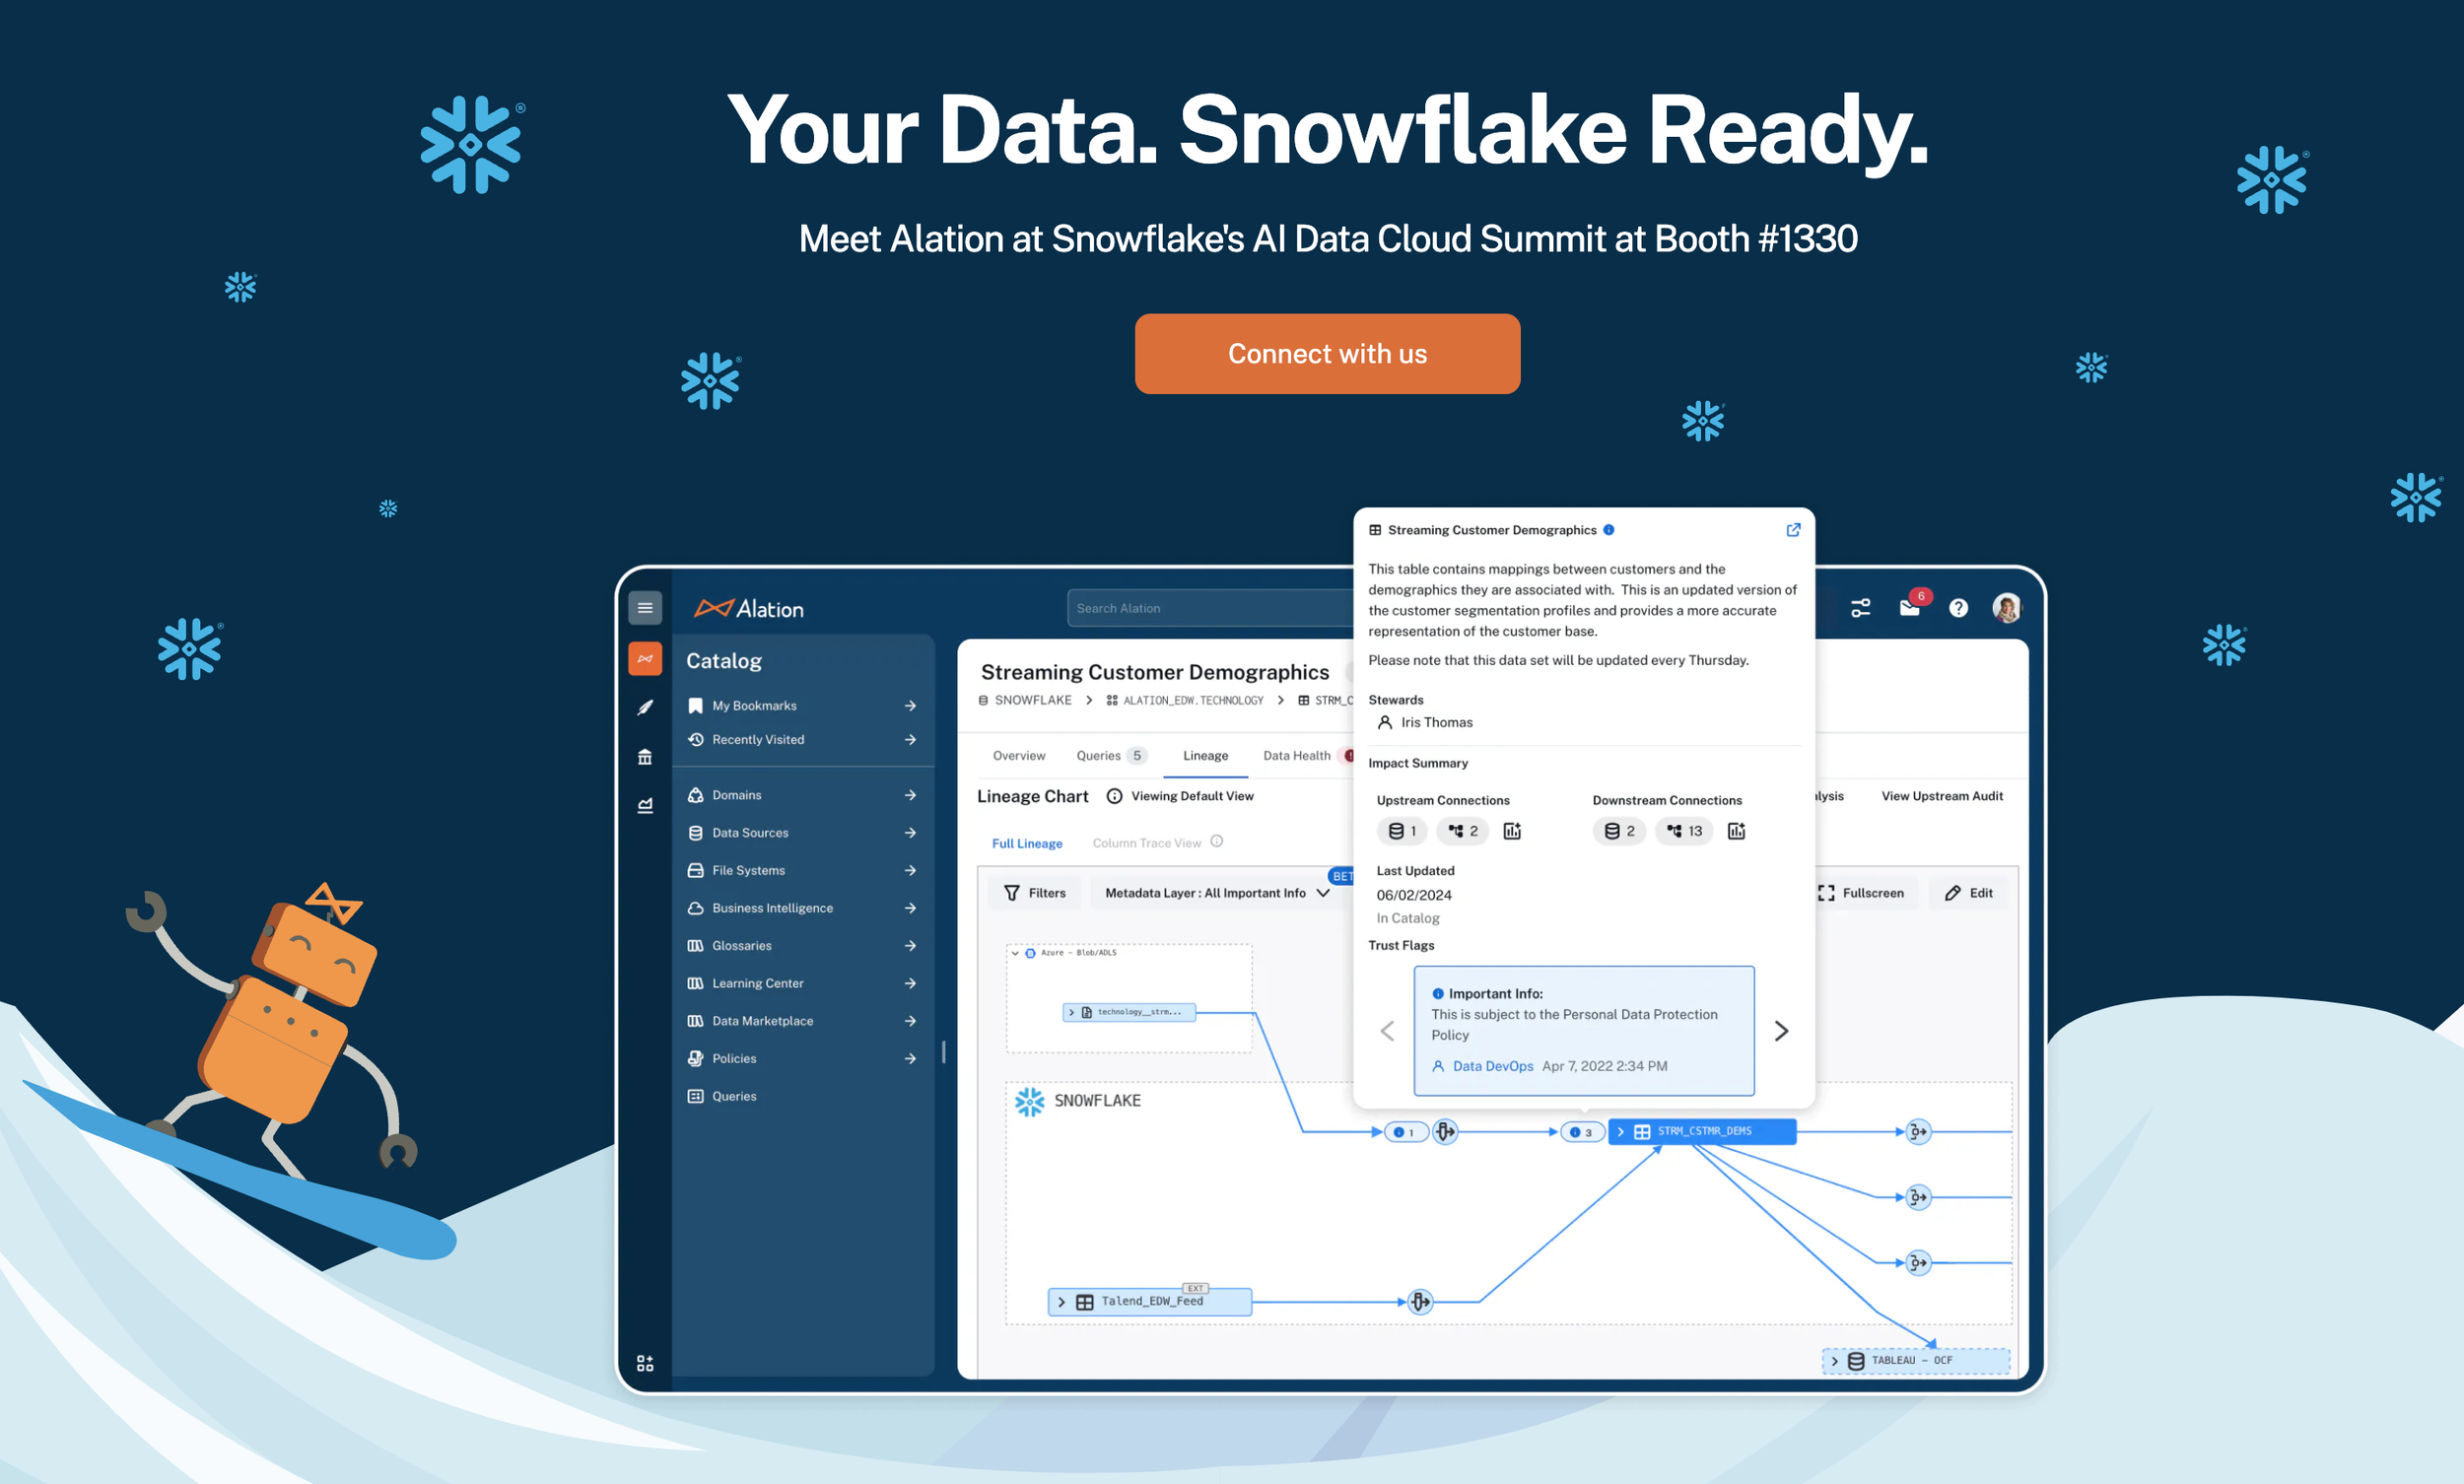
Metadata Layer Overlays featured on Alation’s website
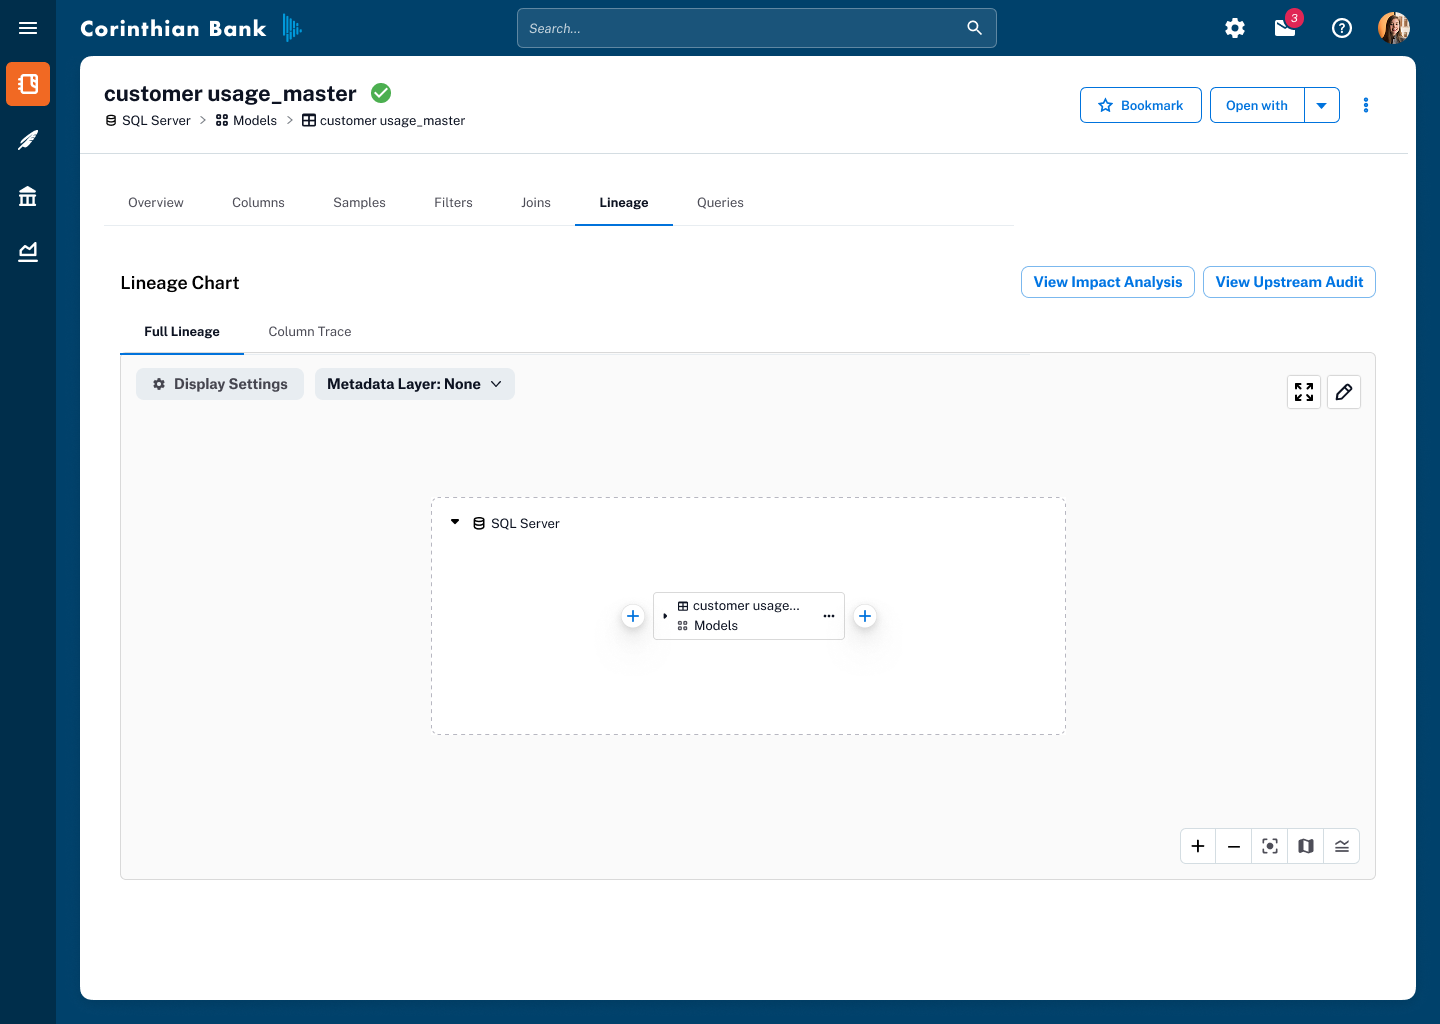
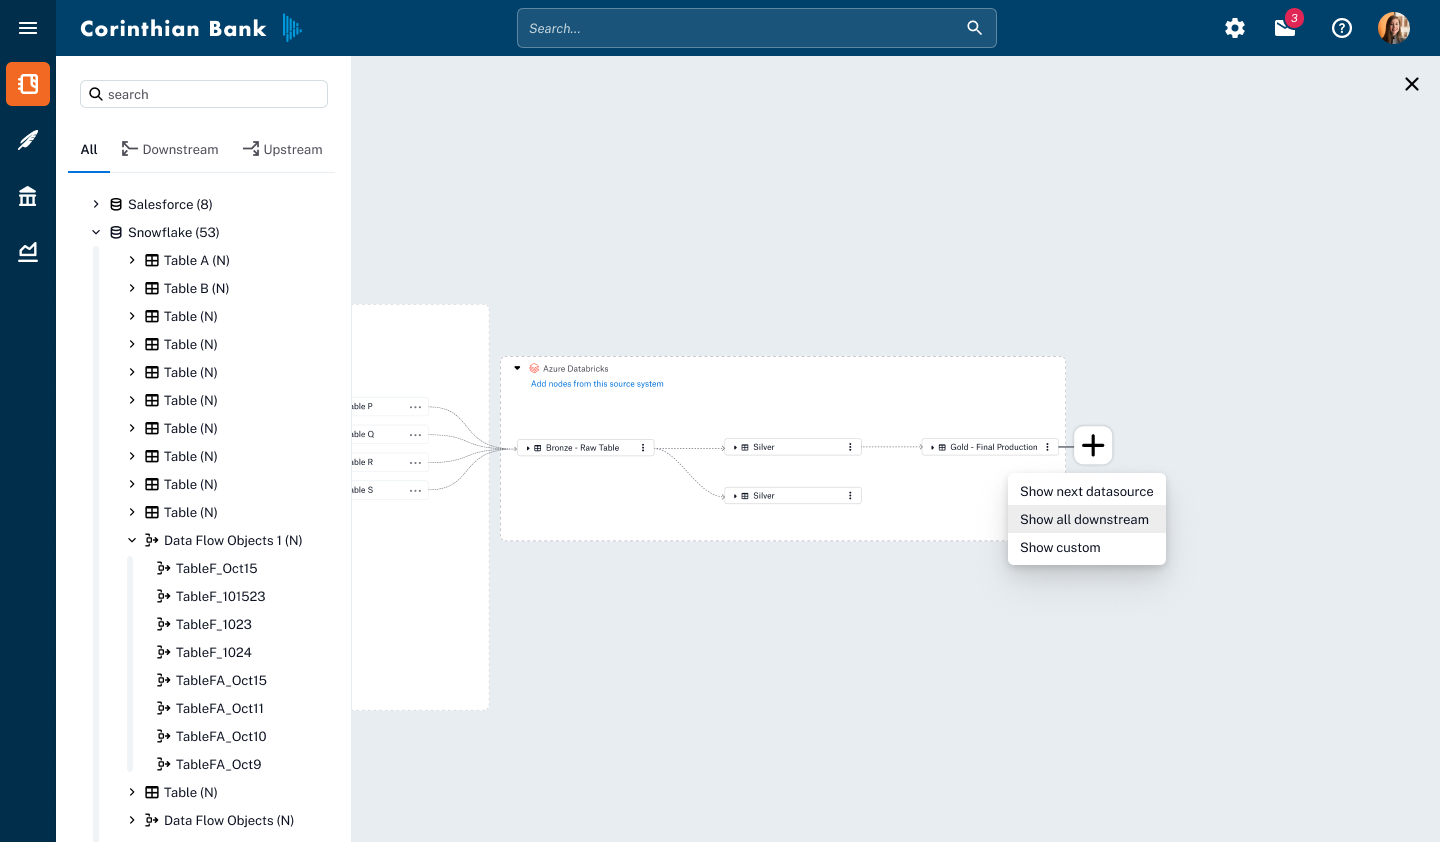
Incremental Loading
To reduce visual overload and improve performance in large lineage graphs, we introduced incremental loading—allowing users to reveal objects step-by-step rather than loading the entire graph at once. This created a more exploratory, “choose your own route” experience, letting users follow the paths most relevant to them without system lag.

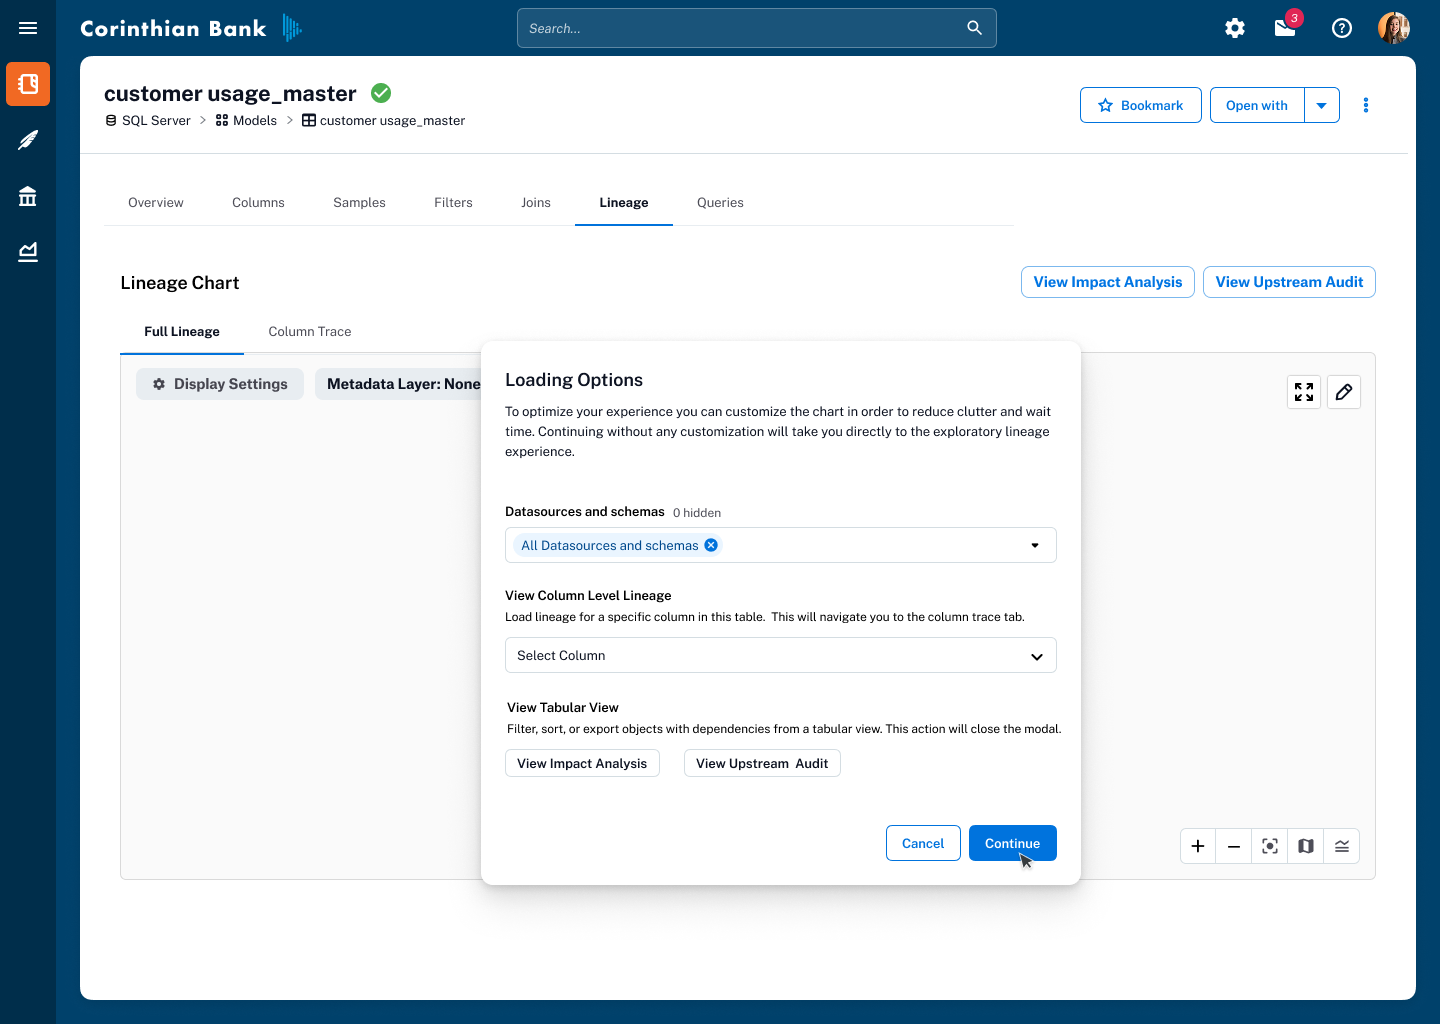
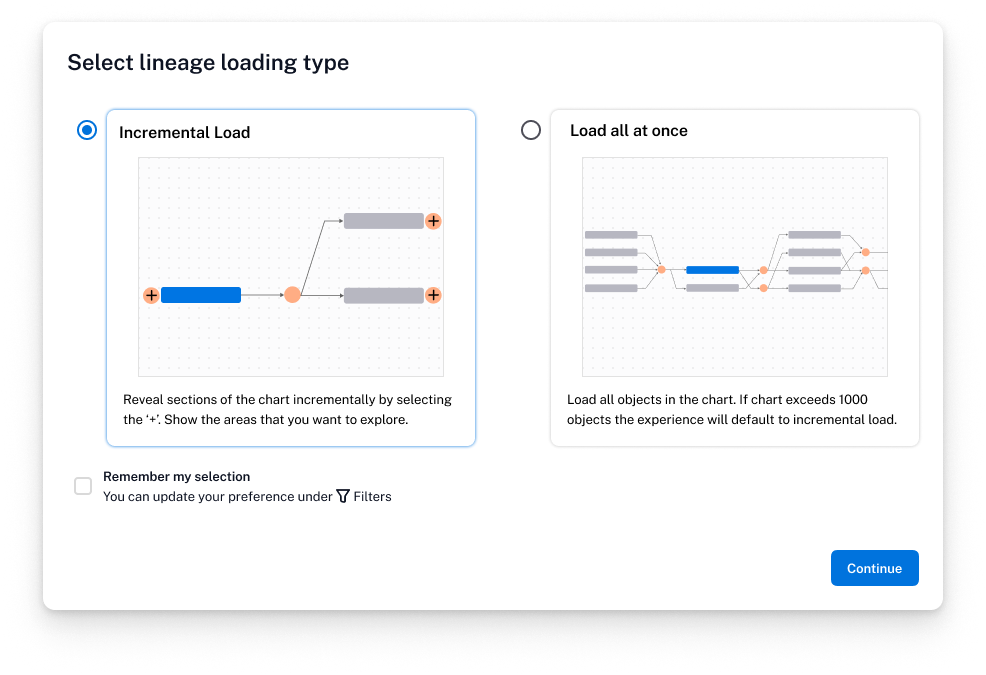
As we rolled this out to a broader audience, we added a prompt giving users the choice between incremental loading and load all at once, empowering them to tailor the experience to their workflow and system needs.
Other Improvements and Explorations
For situations where automated lineage capture wasn’t complete or needed correction, we added a better Manual Edit experience—giving stewards, analysts, and admins the ability to directly add, remove, or adjust lineage connections.
This capability put control and accuracy back in the hands of subject matter experts, ensuring that the lineage graph could be trusted as a source of truth even when ingestion pipelines missed transformations or relationships. The design emphasized clarity and safeguards, with confirmation states and clear visual cues to prevent accidental changes while keeping the workflow efficient.
Without a way to fix gaps or inaccuracies, lineage risked becoming a static diagram rather than a reliable tool for decision-making. By empowering users to manually edit lineage, we closed the loop between automated capture and human expertise, ensuring the graph stayed accurate, current, and trusted—critical for compliance, impact analysis, and confident data usage.
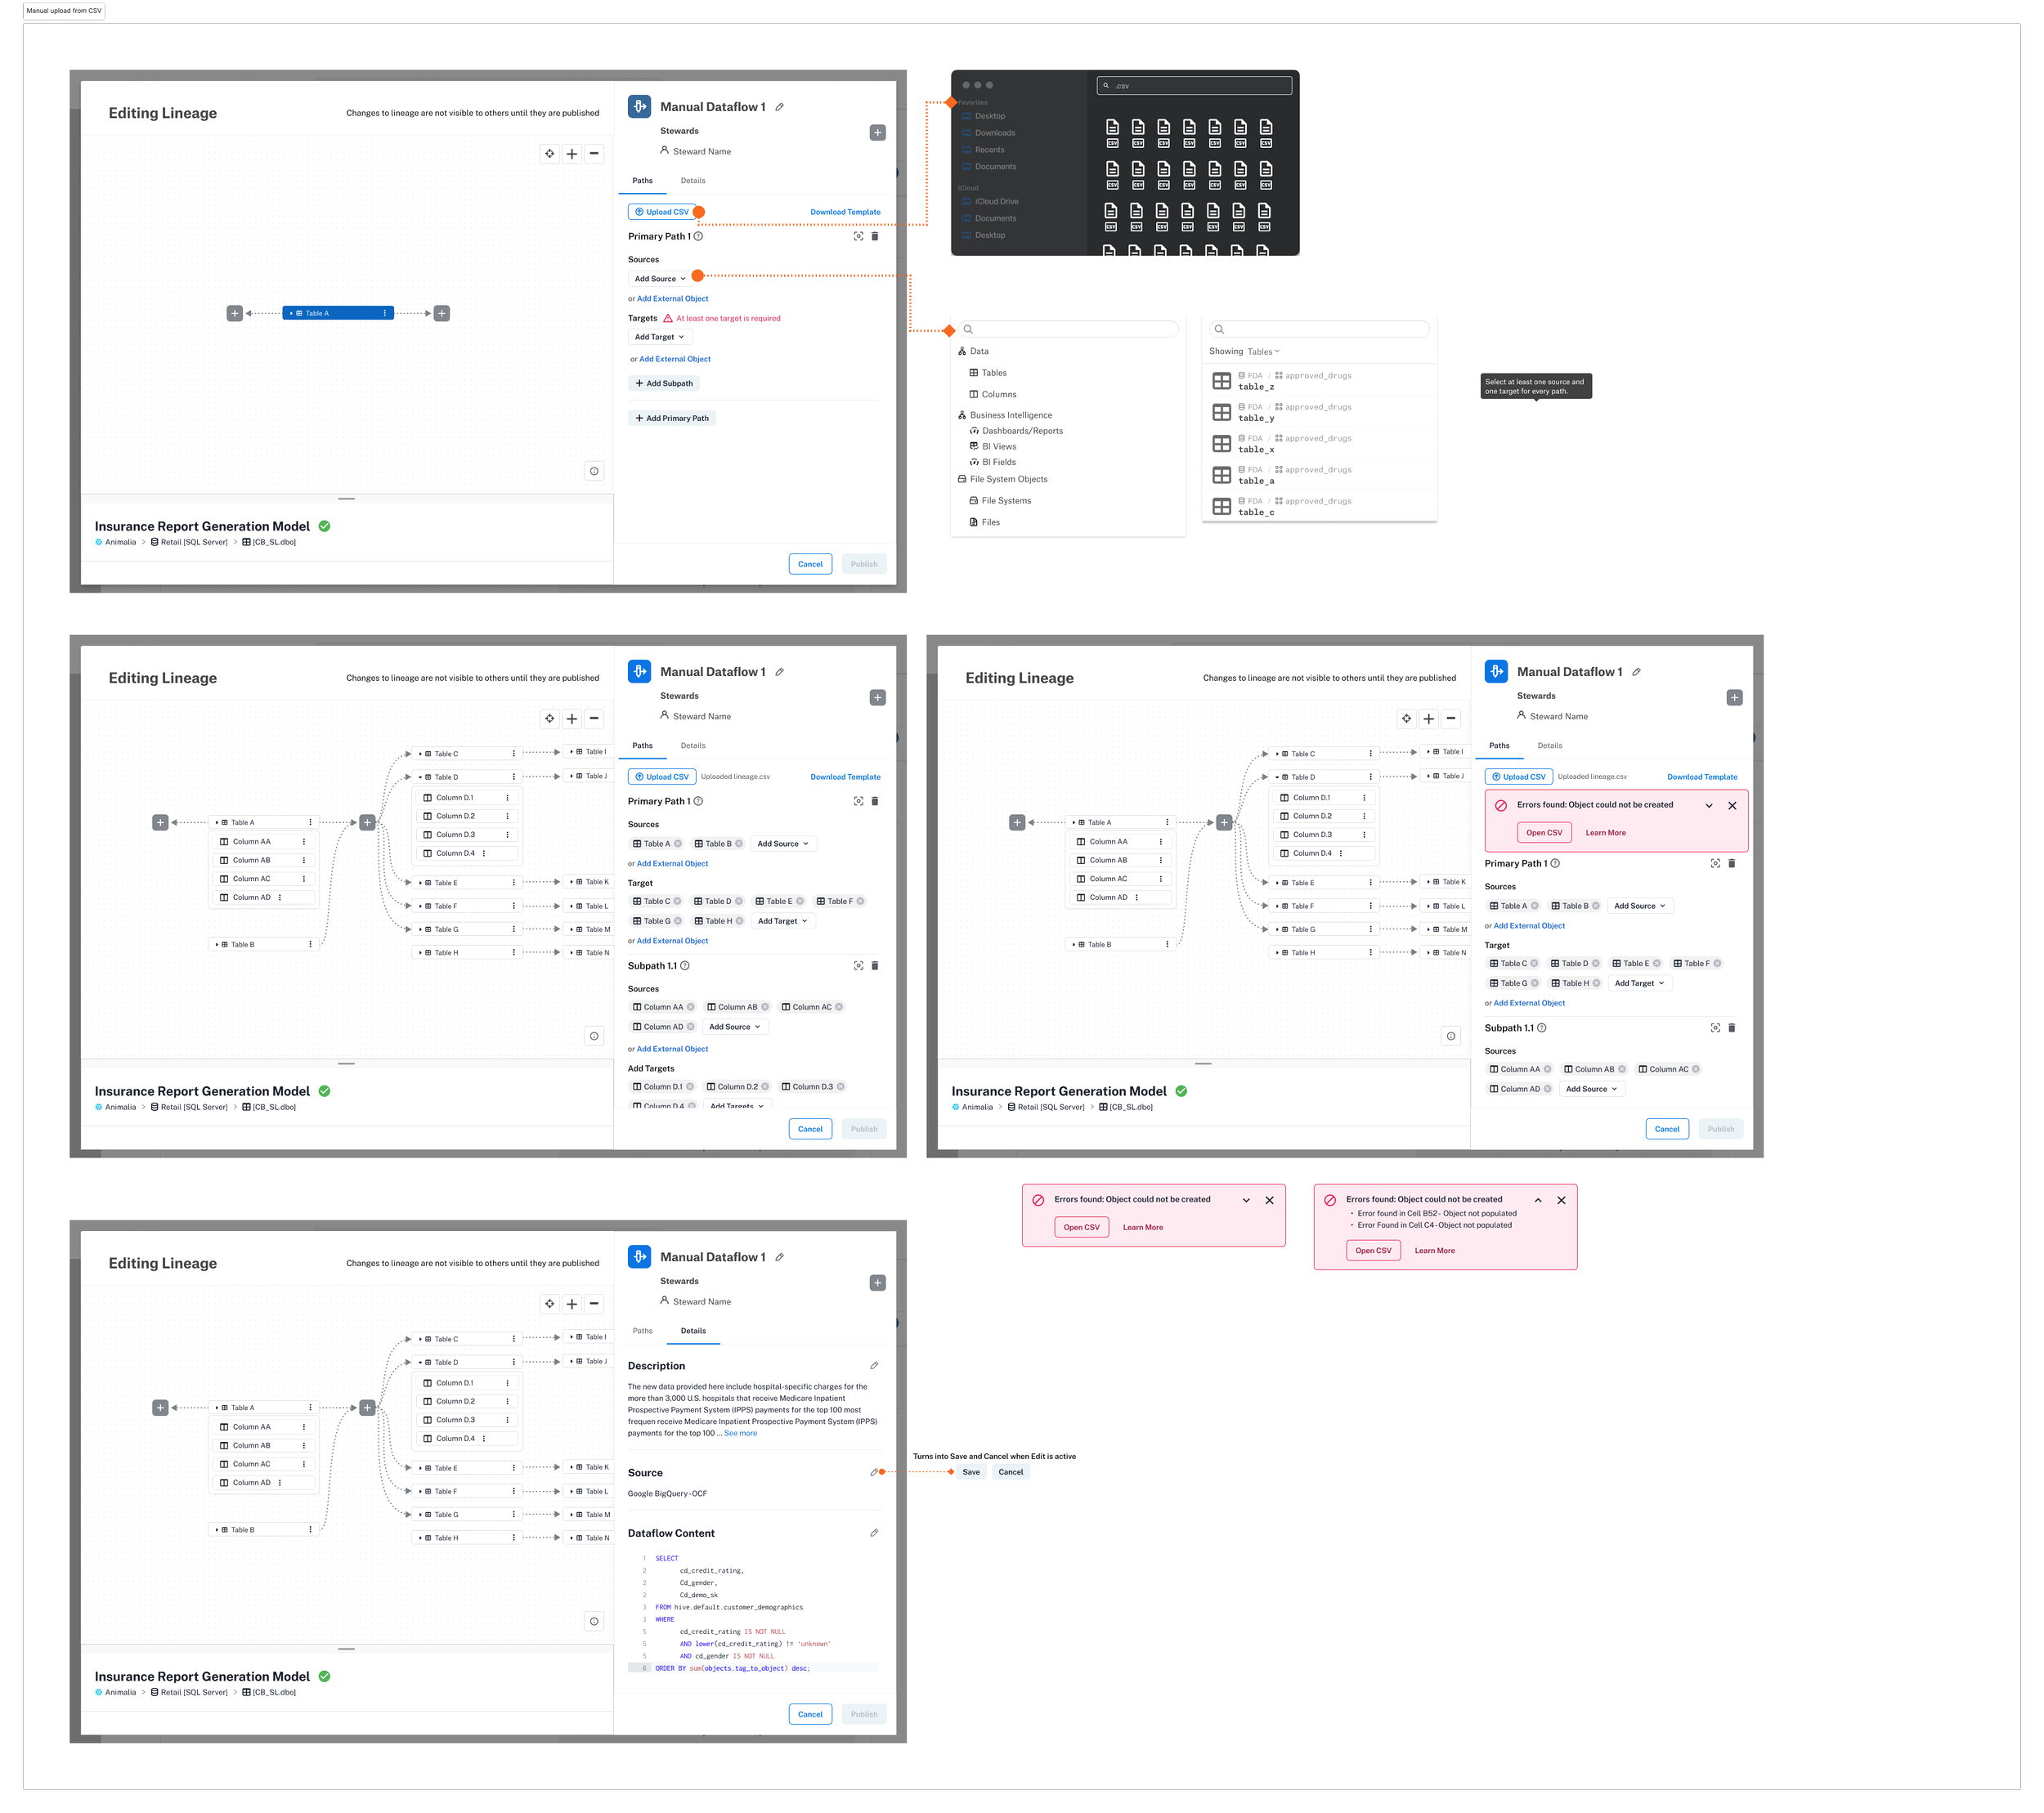
Manually edit Lineage
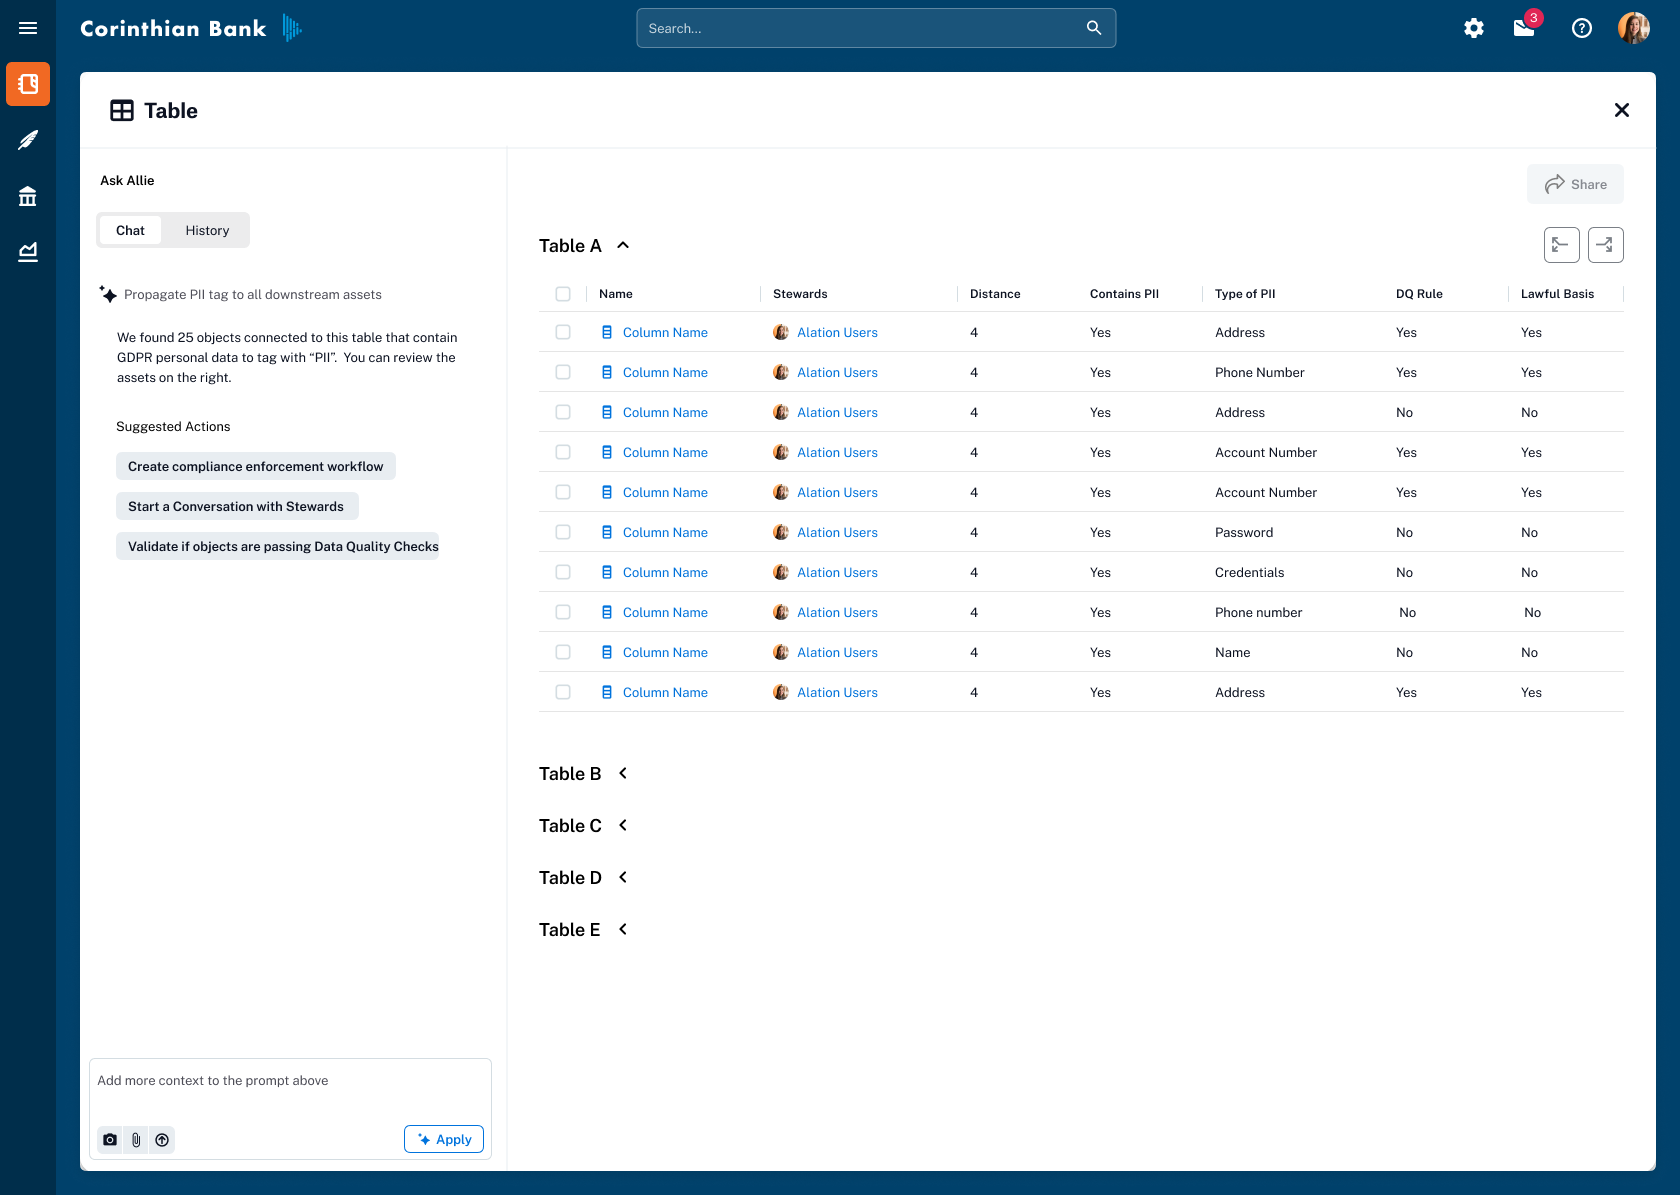
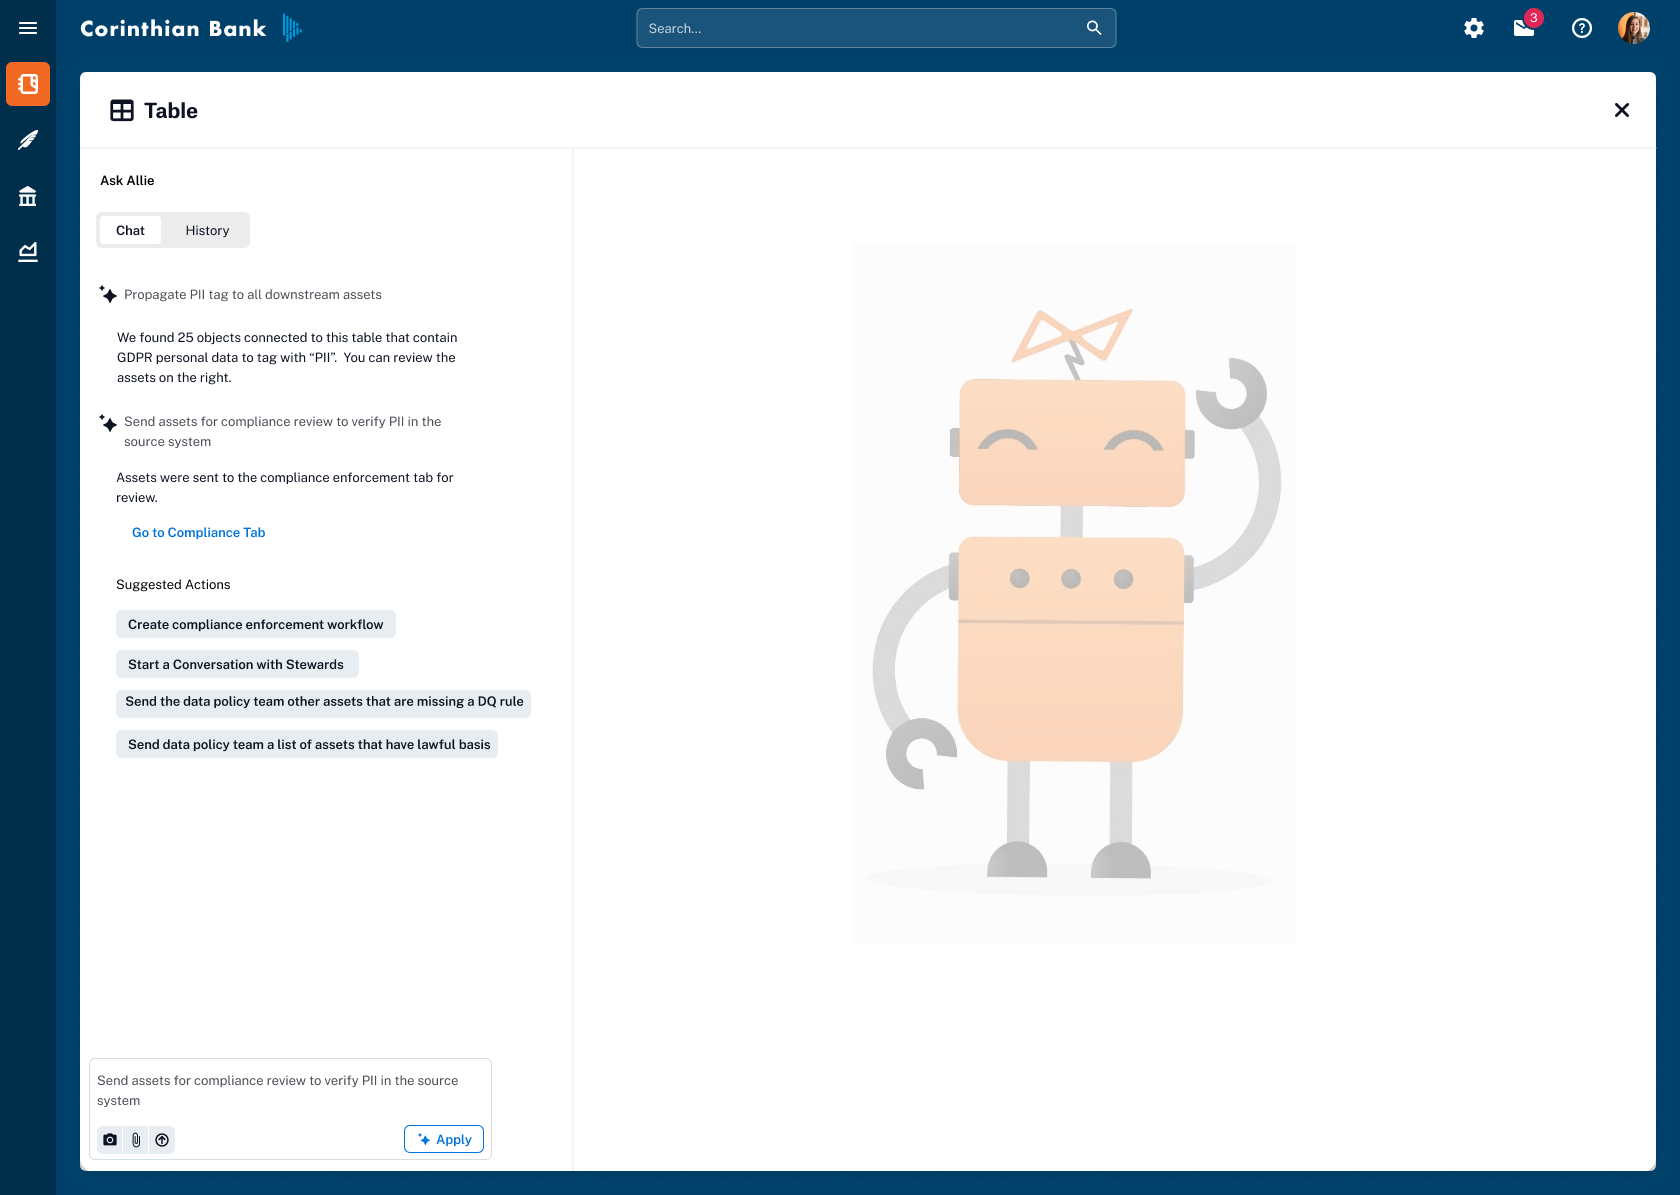
Exploring AI-powered features that leverage Lineage
Prototyped a chat-like experience where users could instruct AI to apply or propagate metadata flags (e.g., PII, GDPR) across related assets. The goal was to reduce repetitive manual tagging and speed up compliance workflows while keeping users in control through confirmation steps.
Outcome
The designs for Exploratory Lineage became the foundation for Alation’s lineage roadmap. The first phase shipped with improved readability, performance, and incremental loading, followed by the release of the metadata layer overlay—bringing trust flags, custom fields, and data quality context directly into the lineage view.
By replacing a chaotic, “spaghetti monster” graph with a clear, interactive map, we turned lineage into a tool that drives adoption and supports critical workflows — from compliance reviews to pipeline optimization.