0
Skip to Content
Cecilia Silvestre
Case Studies
About
Open Menu
Close Menu
Cecilia Silvestre
Case Studies
About
Open Menu
Close Menu
Case Studies
About
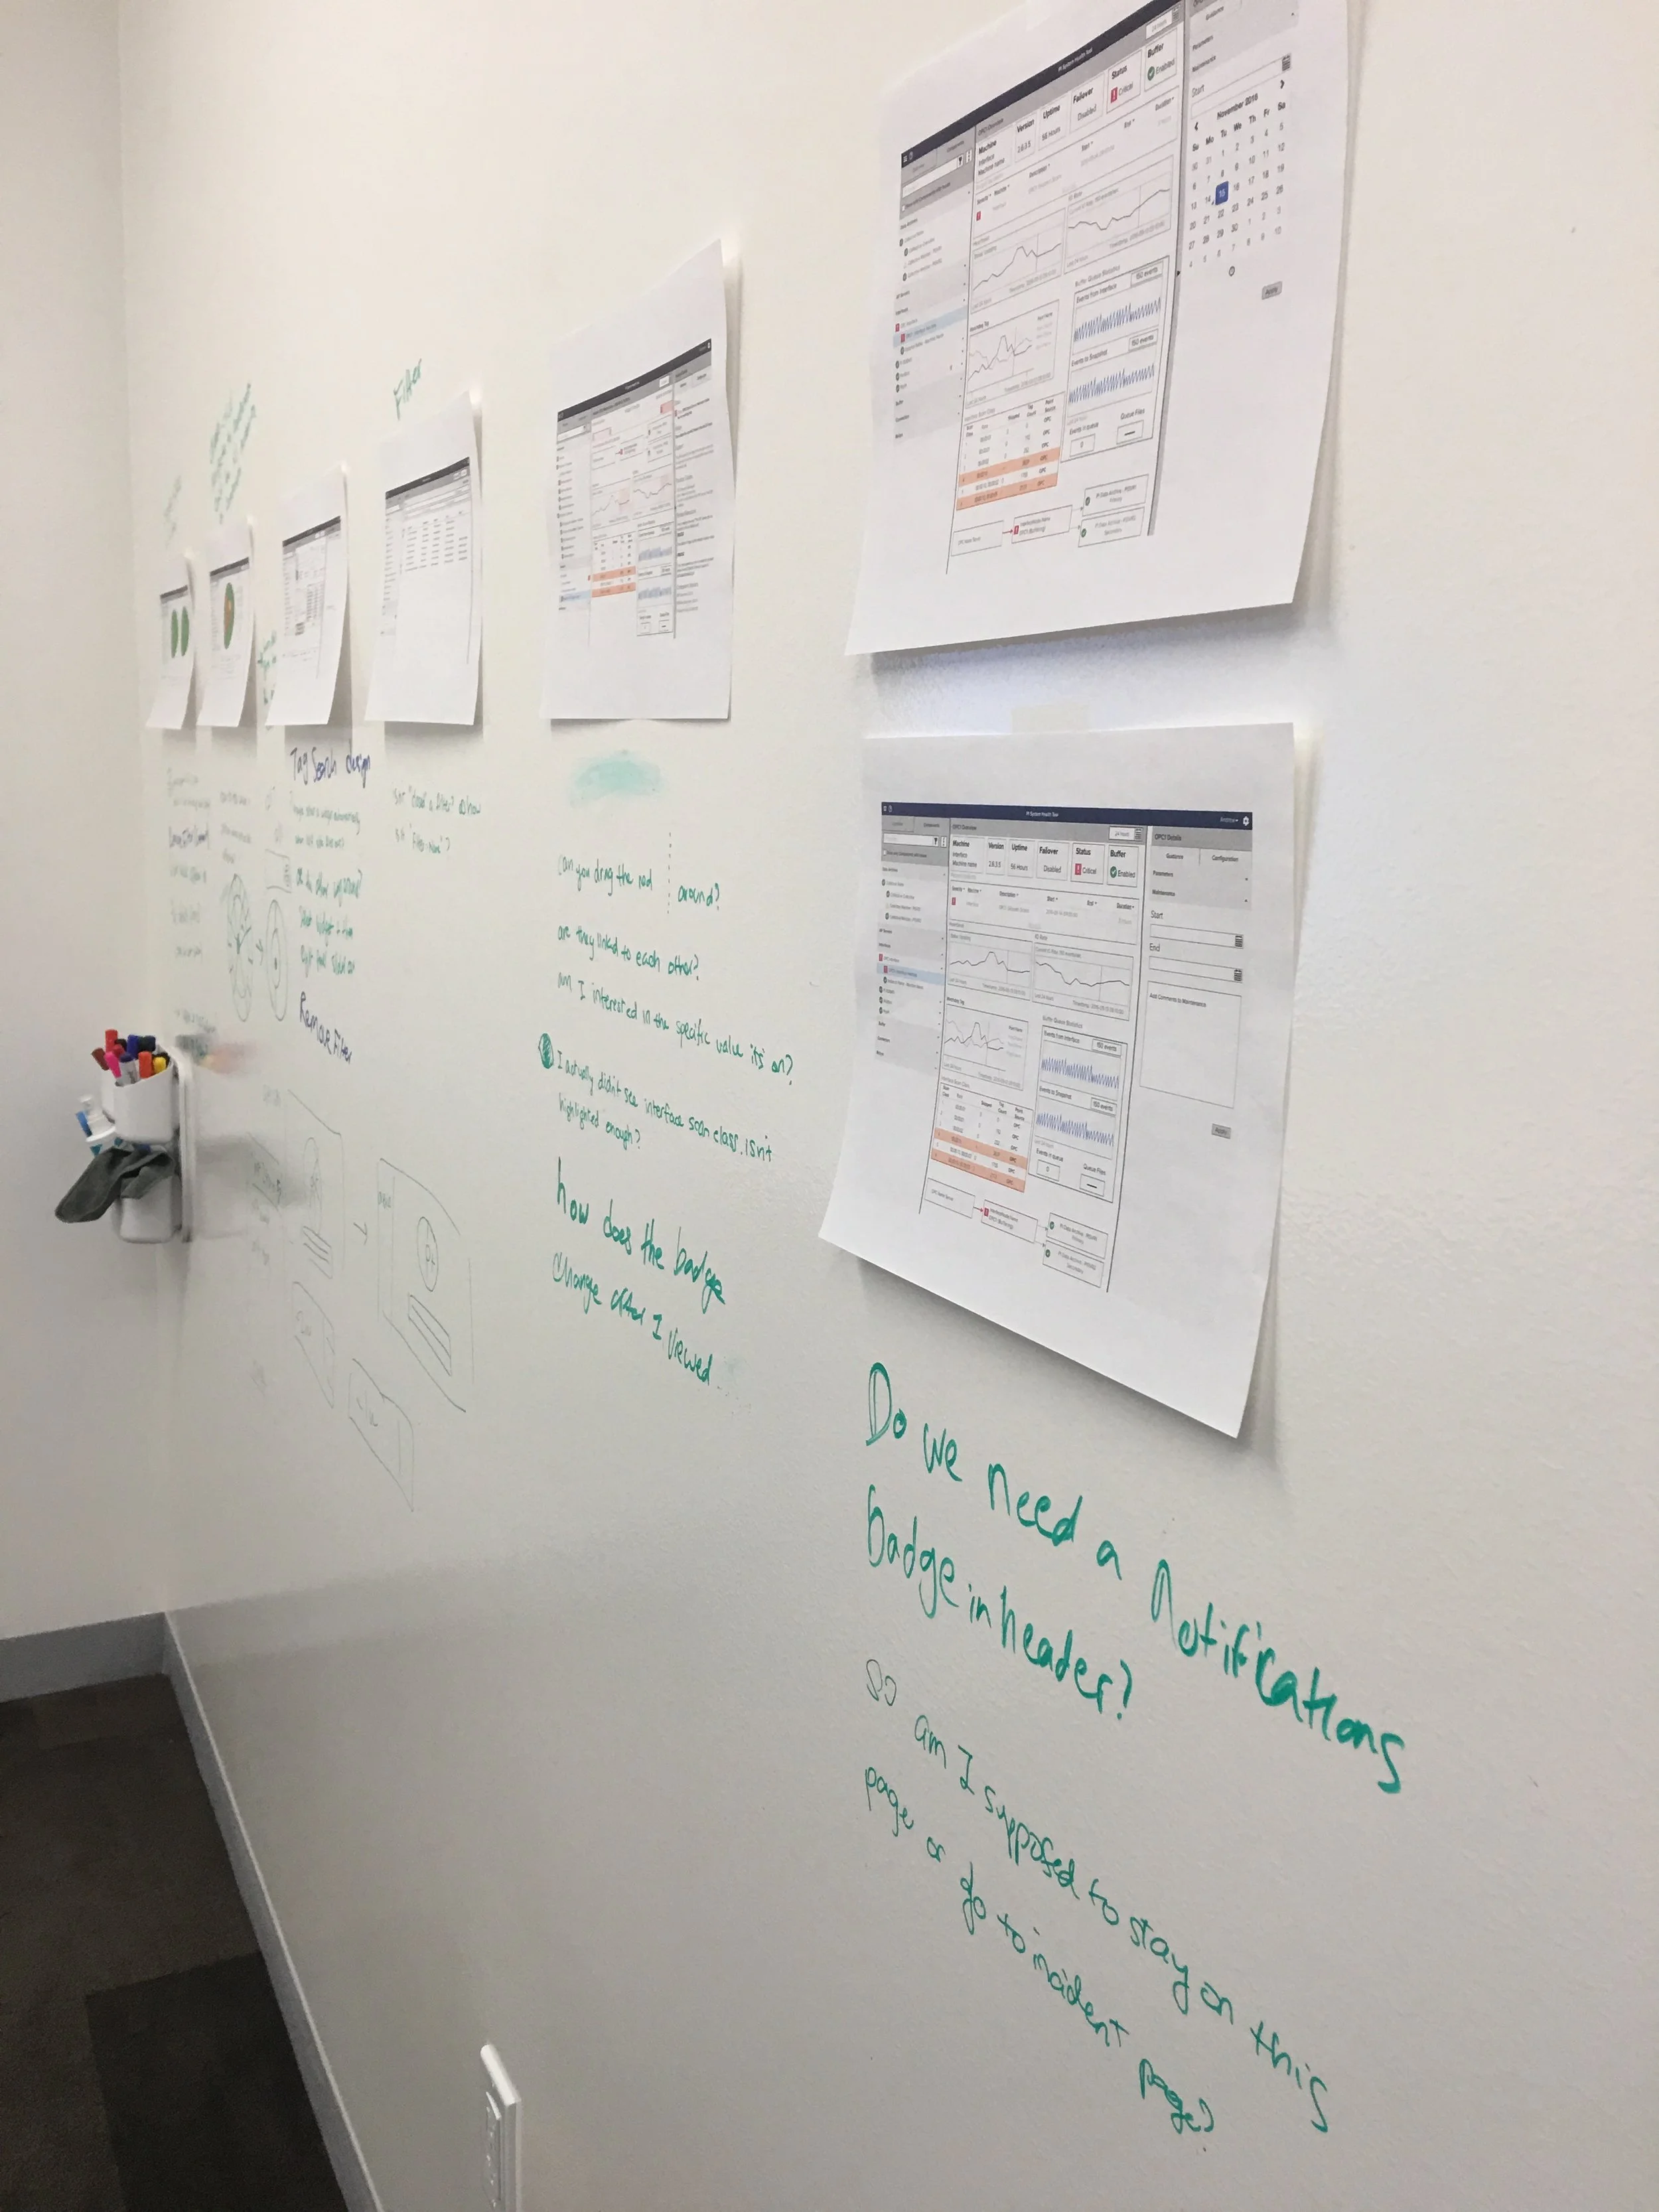
PI System Health