Alation · Data Quality · 0→1 Product
Scaling Data Quality
Architecting a standards-driven platform that unified governance, monitoring, and anomaly detection into one scalable workflow—generating $2M+ ARR in six months.
Why Enterprise Data Quality Was Broken
For large enterprises, operationalizing data quality has historically been a structural impossibility. Existing tools—including several competitors we studied closely—forced data engineers to manually configure rules table by table.
Inconsistent coverage. Only the datasets with the loudest stakeholders got monitored. Rule drift. Without a central source of truth, duplicate and conflicting rules multiplied across teams. Signal noise. Technical users drowned in disconnected alerts with no way to triage what mattered to the business.
“The problem wasn’t that teams lacked tools. It was that they lacked a mental model for governing data quality at scale. Every competitor was selling a feature set. We needed to sell a framework.”
Data quality is what makes a data catalog trustworthy.
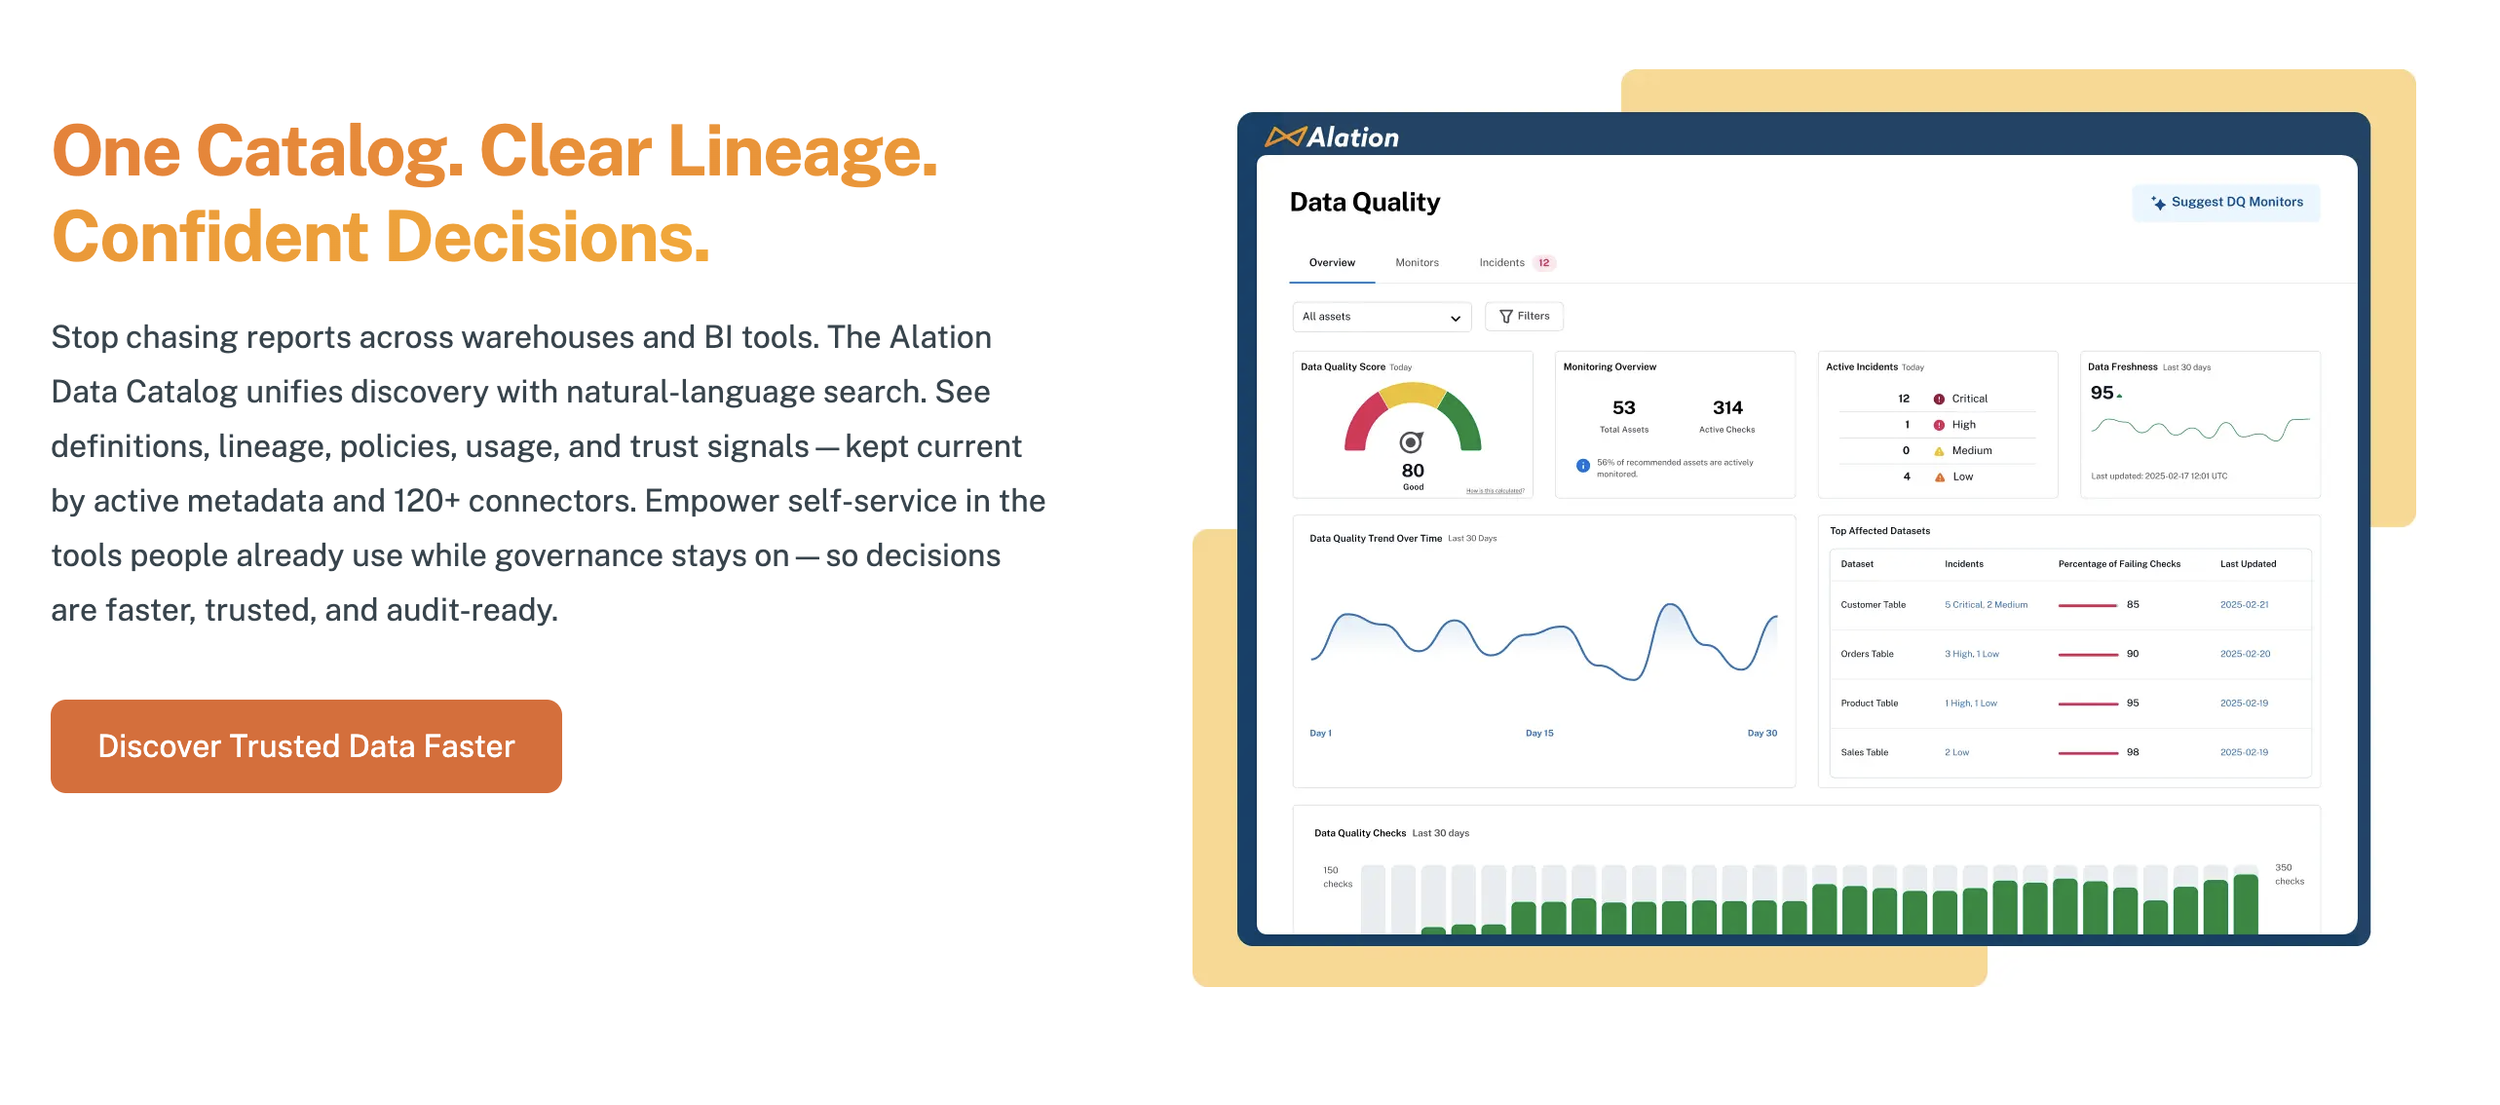
Enterprise teams use Alation to find, understand, and govern their data. But cataloging data isn't enough — people need to know whether what they're finding is actually reliable before they make decisions with it. Is it complete? Is it fresh? Does it conform to business rules? Without those answers, a catalog is a directory with no signal about what you can trust.
Before native data quality, customers bolted on separate tools to monitor their data — meaning two platforms, two mental models, and governance signals that contradicted quality signals. The strategic opportunity: consolidate quality into the catalog itself, so governance actions and quality checks live in one place, giving teams a single answer to the question every data consumer is actually asking: "Can I trust this data?"
AI-Accelerated, Not AI-Substituted
I used V0 by Vercel and Figma Make extensively for rapid prototyping—exploring dozens of layout variations, flow structures, and edge-case states in hours rather than days.
But speed did not replace rigor. Every concept was run through Jobs-to-Be-Done framing (what outcome is the user hiring this for?), outcome and task mapping (decomposing jobs into measurable outcomes), and structured critique with PMs, engineers, and SMEs against defined success criteria.
The AI tools were a multiplier on my process, not a replacement for it.
Role and Ownership
As the lead product designer, I owned the end-to-end experience strategy, system model, and interaction design for Alation's first native Data Quality platform. This was a 0-to-1 product effort—there was no existing feature to iterate on.
I defined the conceptual architecture—the object model of Standards, Monitors, and their relationships—which engineering adopted as the product's structural foundation. I led cross-functional discovery through structured Jobs-to-Be-Done workshops and outcome mapping. I drove customer research across enterprise accounts, uncovering the critical insight: users' frustration wasn't about writing rules—it was about knowing where to apply them and trusting what they'd break.
I presented directly to customers and executive stakeholders, building alignment between Sales, Engineering, and Product. And I pushed back on roadmap sequencing to advocate for shipping the Standards abstraction before surface-level features, arguing successfully that the conceptual model had to be right first.
Growing the Team Alongside the Product
As Data Quality matured beyond v1, I brought a junior designer onto the team and made his growth a deliberate part of the project's success. Rather than assigning peripheral tasks, I gave him ownership of substantive feature areas—redesigning the monitoring dashboard and designing the query cost and runtime visibility surfaces (critical for a product with AI-powered integrations where customers need transparency into computational cost).
My approach was twofold: building his confidence presenting and defending design decisions in cross-functional settings through structured, low-stakes opportunities, and giving him genuine ownership—he wasn't executing my designs, he was making his own decisions with my guidance on framing, tradeoffs, and stakeholder communication.
He went from hesitant in critiques to confidently leading design reviews for his feature areas, and the work he owned shipped as part of the product's core experience.
Design Decisions That Shaped the Product
The Monitor as a Hub
Existing tools often organize their Data Quality checks by tables. While you can still monitor at the column level you cannot group your checks into an organizational unit, which means related checks across multiple tables live in separate, disconnected views, and column-level checks outside of a table context end up ungrouped and hard to manage. Users don't think in tables. They think in business concepts: "Quarterly Financials," "Customer PII Pipeline," "Checkout Funnel."
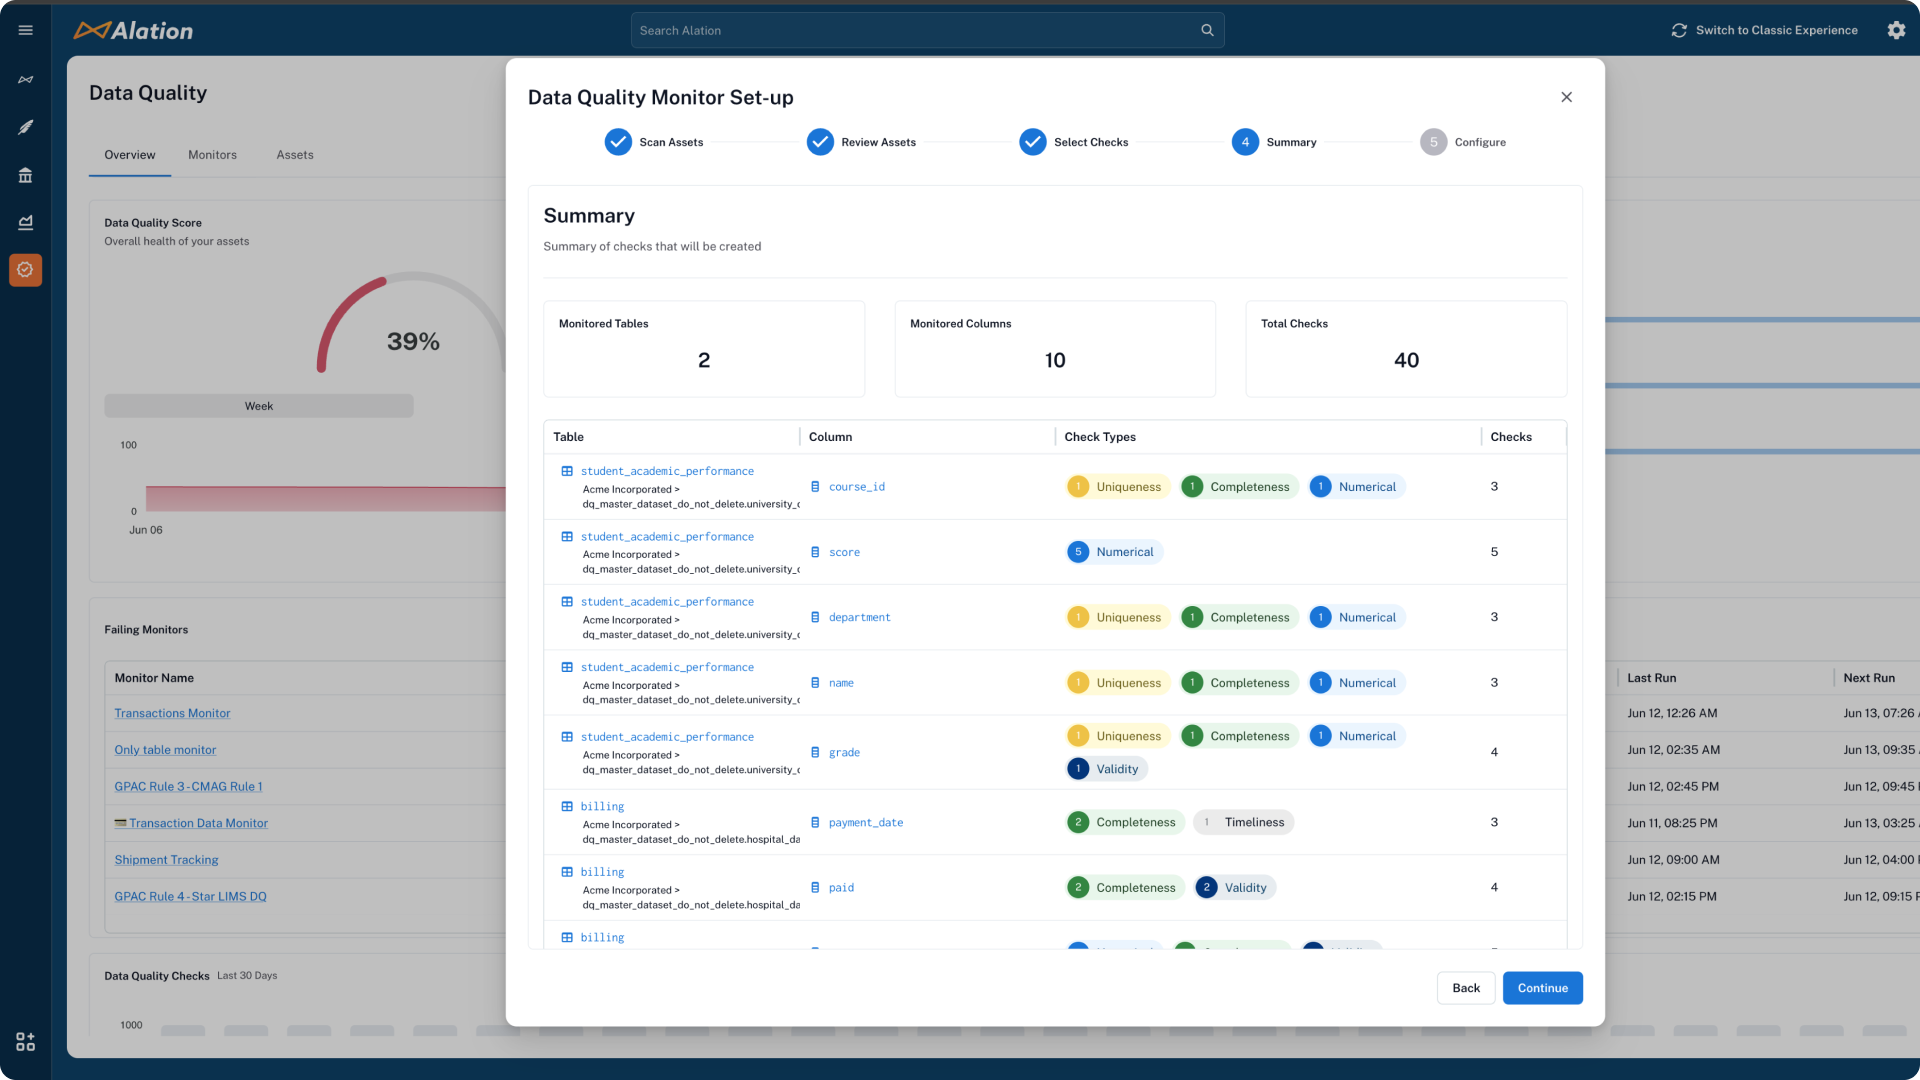
We designed the monitor as a hub — a flexible container where users group tables and columns into logical segments that match how they actually organize their work. A single monitor can span multiple tables, target specific columns across them, and mix different check types and anomaly detection. The result is a solution that is flexible enough to handle complex use cases but structured enough that it doesn't become overwhelming.
This was our key structural differentiator. The monitor reflects how the business organizes its data, not how the database organizes it. It gave teams a single, coherent surface for everything related to a domain or workflow, replacing the fragmented table-by-table approach that made quality checks hard to manage at scale.
Monitors are a group of data quality checks that can be configured across tables and columns. A logical grouping that maps to our users’ business models.
Beta Program — Shipping Fast, Learning Faster
We ran a structured beta program to validate the initial monitor flow with real customers before general availability. This was a way to quickly pressure-test and validate the core experience under real enterprise conditions.
Three things landed. Velocity as a differentiator - customers consistently praised the pace of our work, as we delivered the Beta in 3 months, with reactions like "were you already working on this, I can’t believe how fast it came?!” The core UX foundation - users also praised the experience of creating a monitor and the solutions integration within the catalog, noting "it just makes sense." Unified platform value - the consolidation of catalog and data quality into one experience resonated strongly with teams tired of managing separate tools.
The beta also surfaced critical gaps that shaped the next phases of work. Balanced quality and speed - accumulated bugs and minor discrepancies (broken states, timestamp mismatches) eroded trust even when individually small. We recalibrated our approach to treat every feature delivery with more care without sacrificing our velocity AI suggestions were too basic - customers expected intelligent recommendations based on profiled data, not just min/max and completeness. Remediation detail was insufficient - users needed row-level visibility and export capabilities, not just a pass/fail signal. These findings directly drove the design experience and business need for: anomaly detection, incident management, failed row details, and smarter recommendations with profiled data
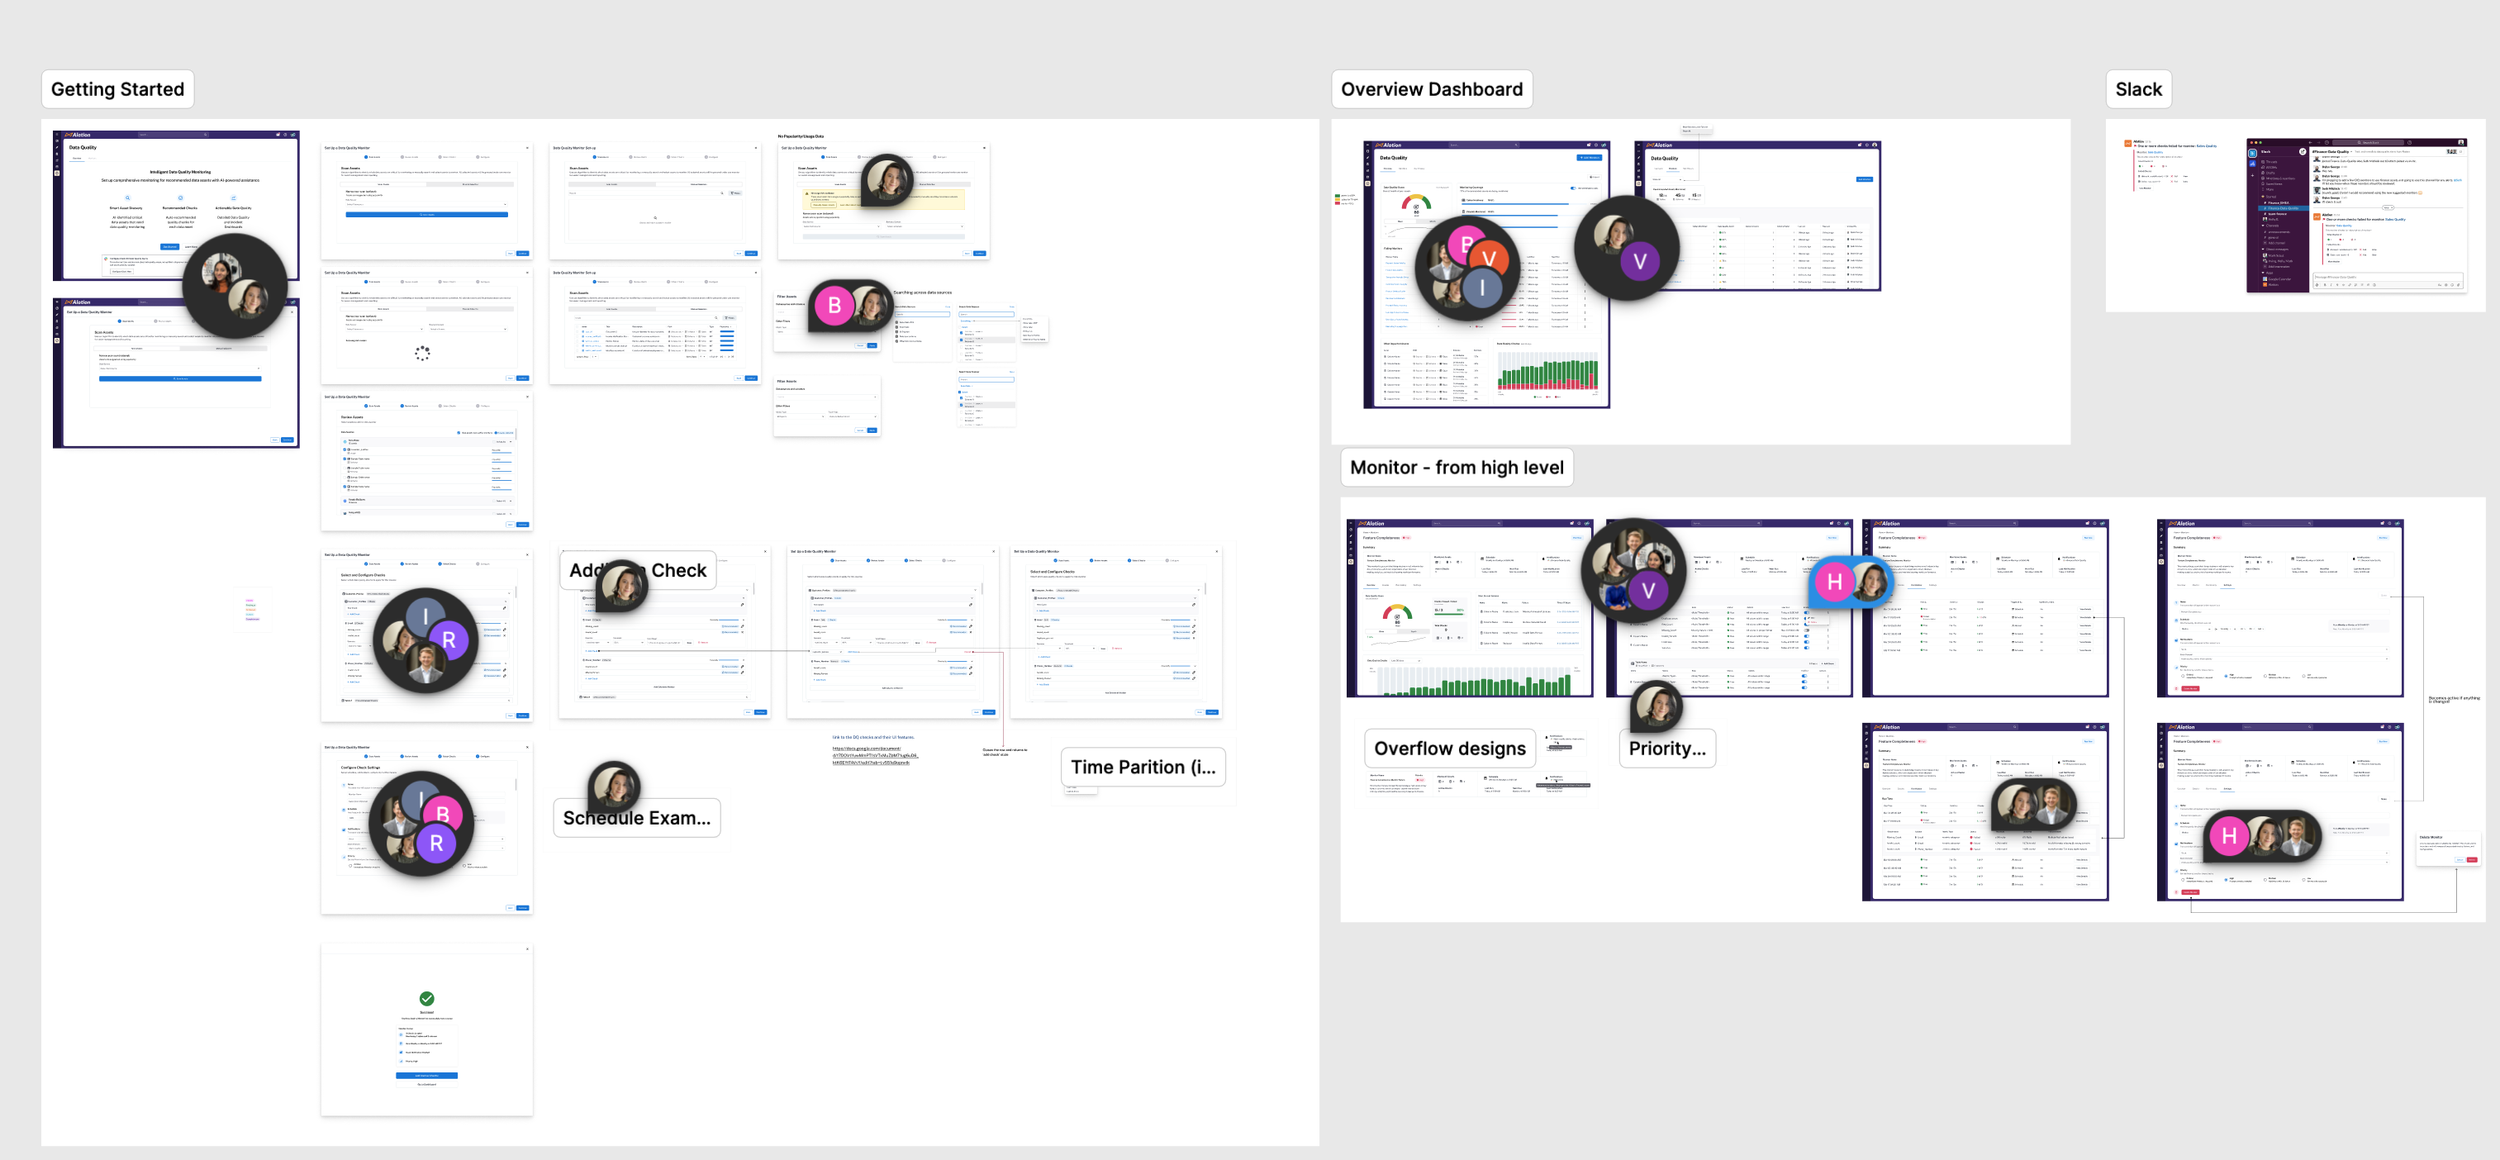
Intentional use of AI
Initial exploration of a Chat Experience
Secondary Exploration with AI Assistant while creating checks
AI Without the Chatbot
There was significant executive pressure to build an AI chatbot for check creation — it was the trending pattern, and the assumption was that conversational AI would make the product feel modern and intelligent. I pushed back.
Our users didn't want a conversation with an AI. They wanted control and visibility. A chatbot creates two problems for this audience: users have no control over what it generates (you're reacting to suggestions in a thread rather than making deliberate choices), and there's no visibility into the logic behind what it recommends. For data governance practitioners — people whose job is to understand exactly what rules are running and why — that's a non-starter. AI doesn't have to be a chatbot. Adopting a pattern because it's a fad, not because it serves the user, is the wrong call.
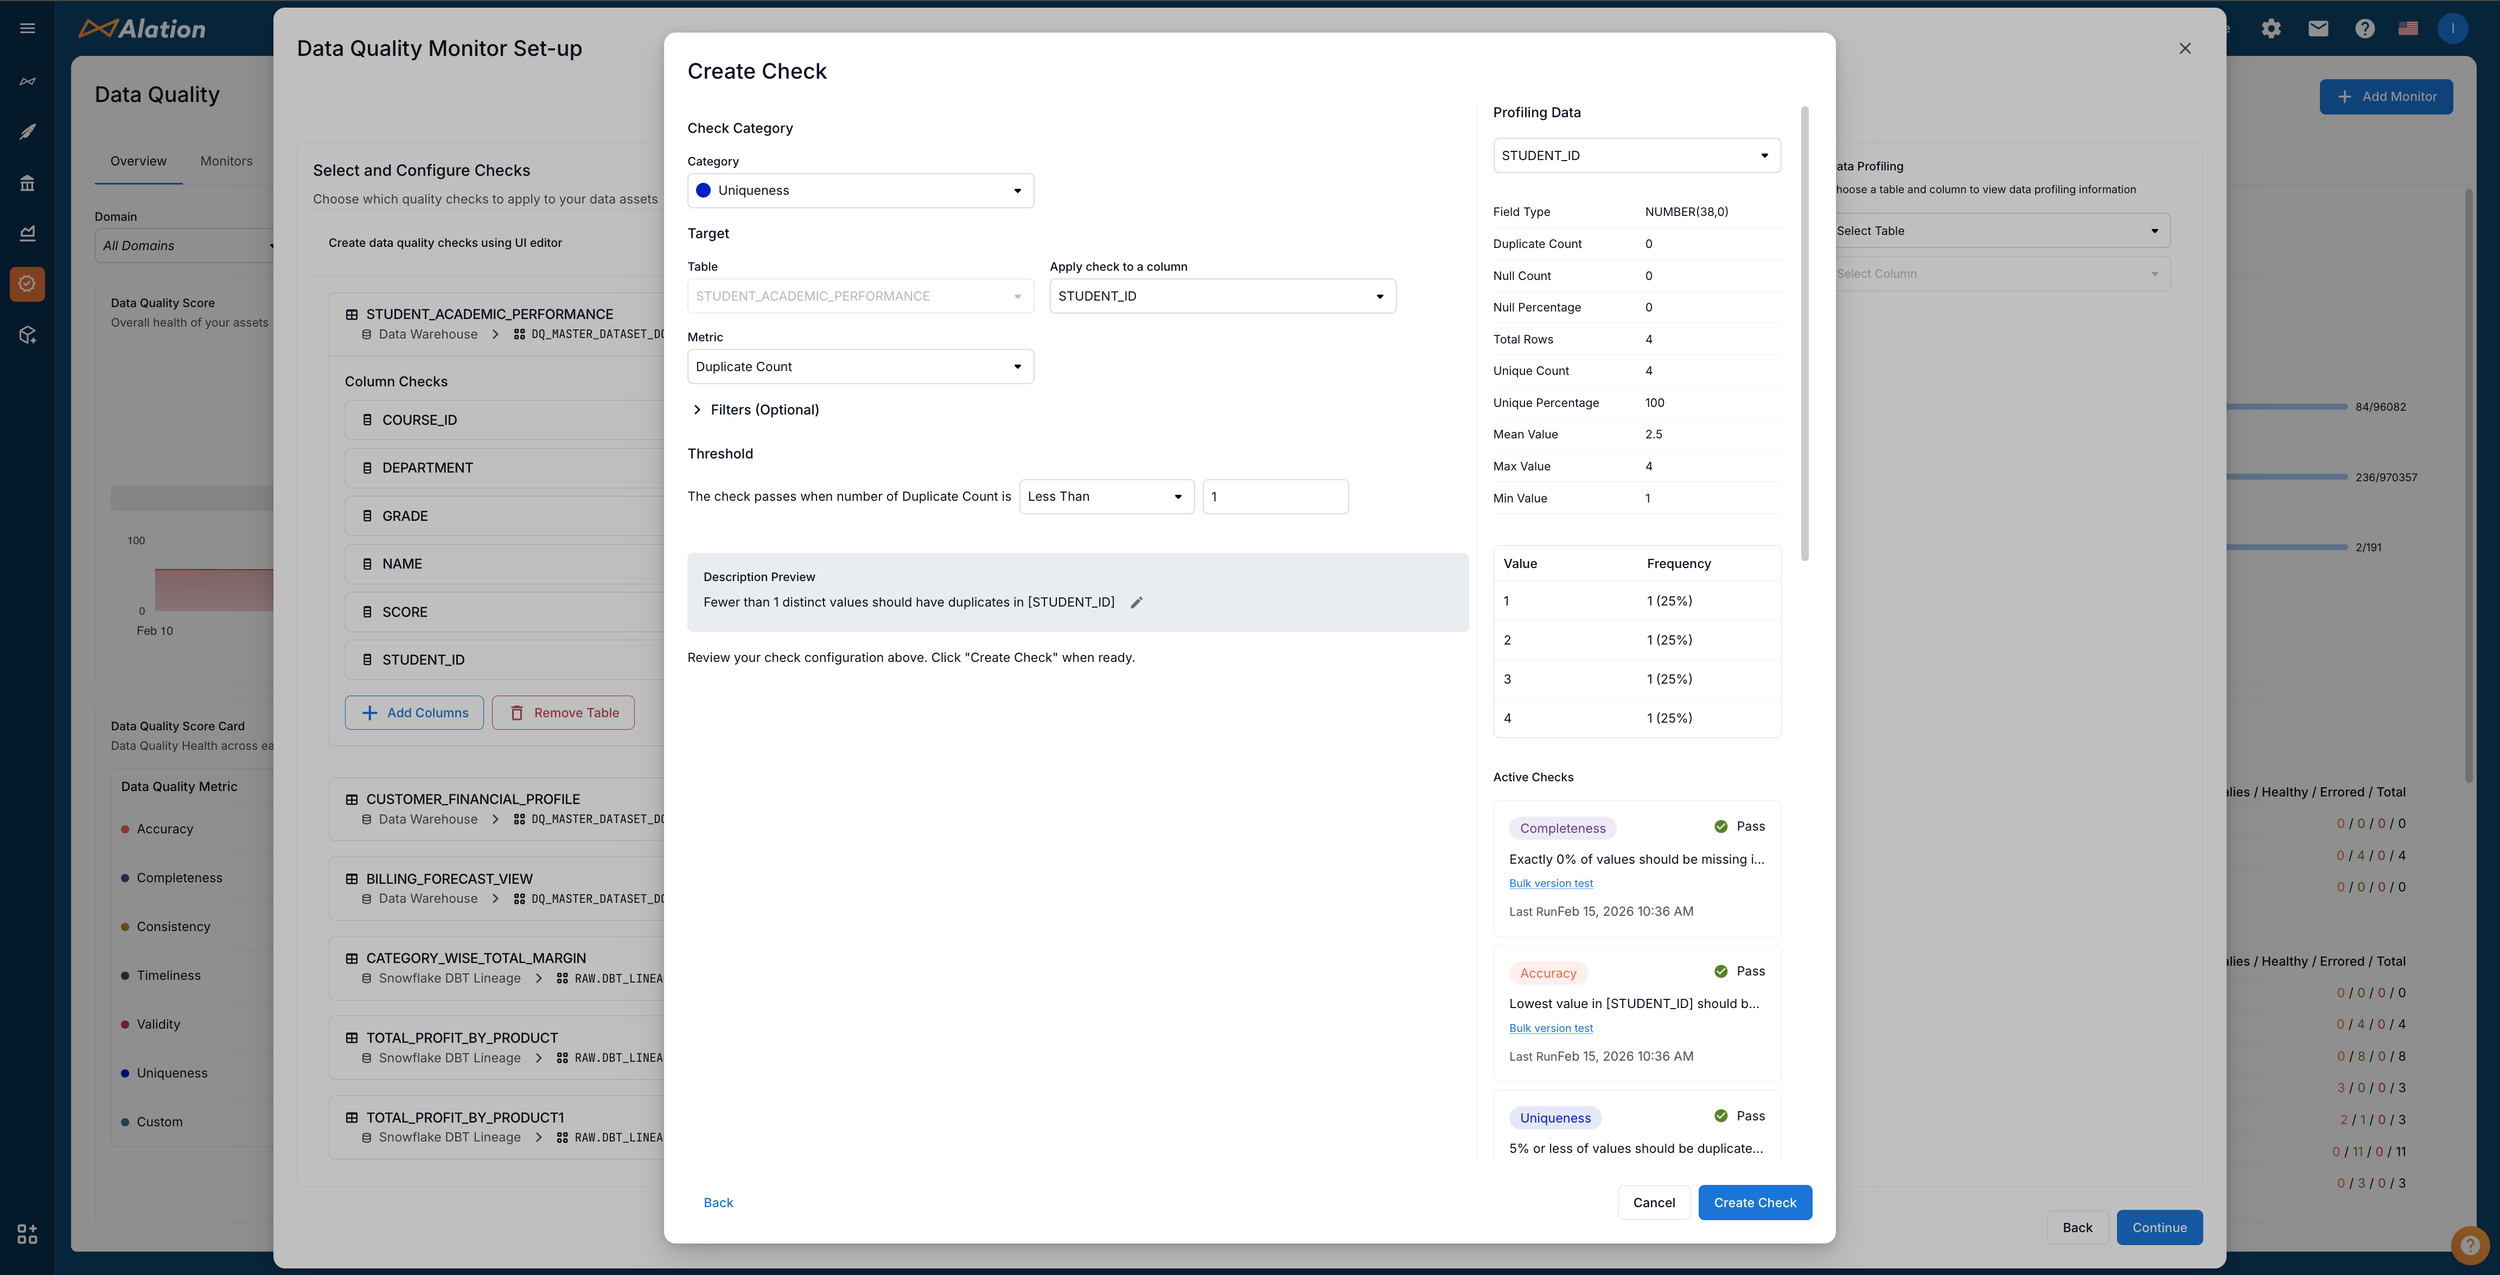
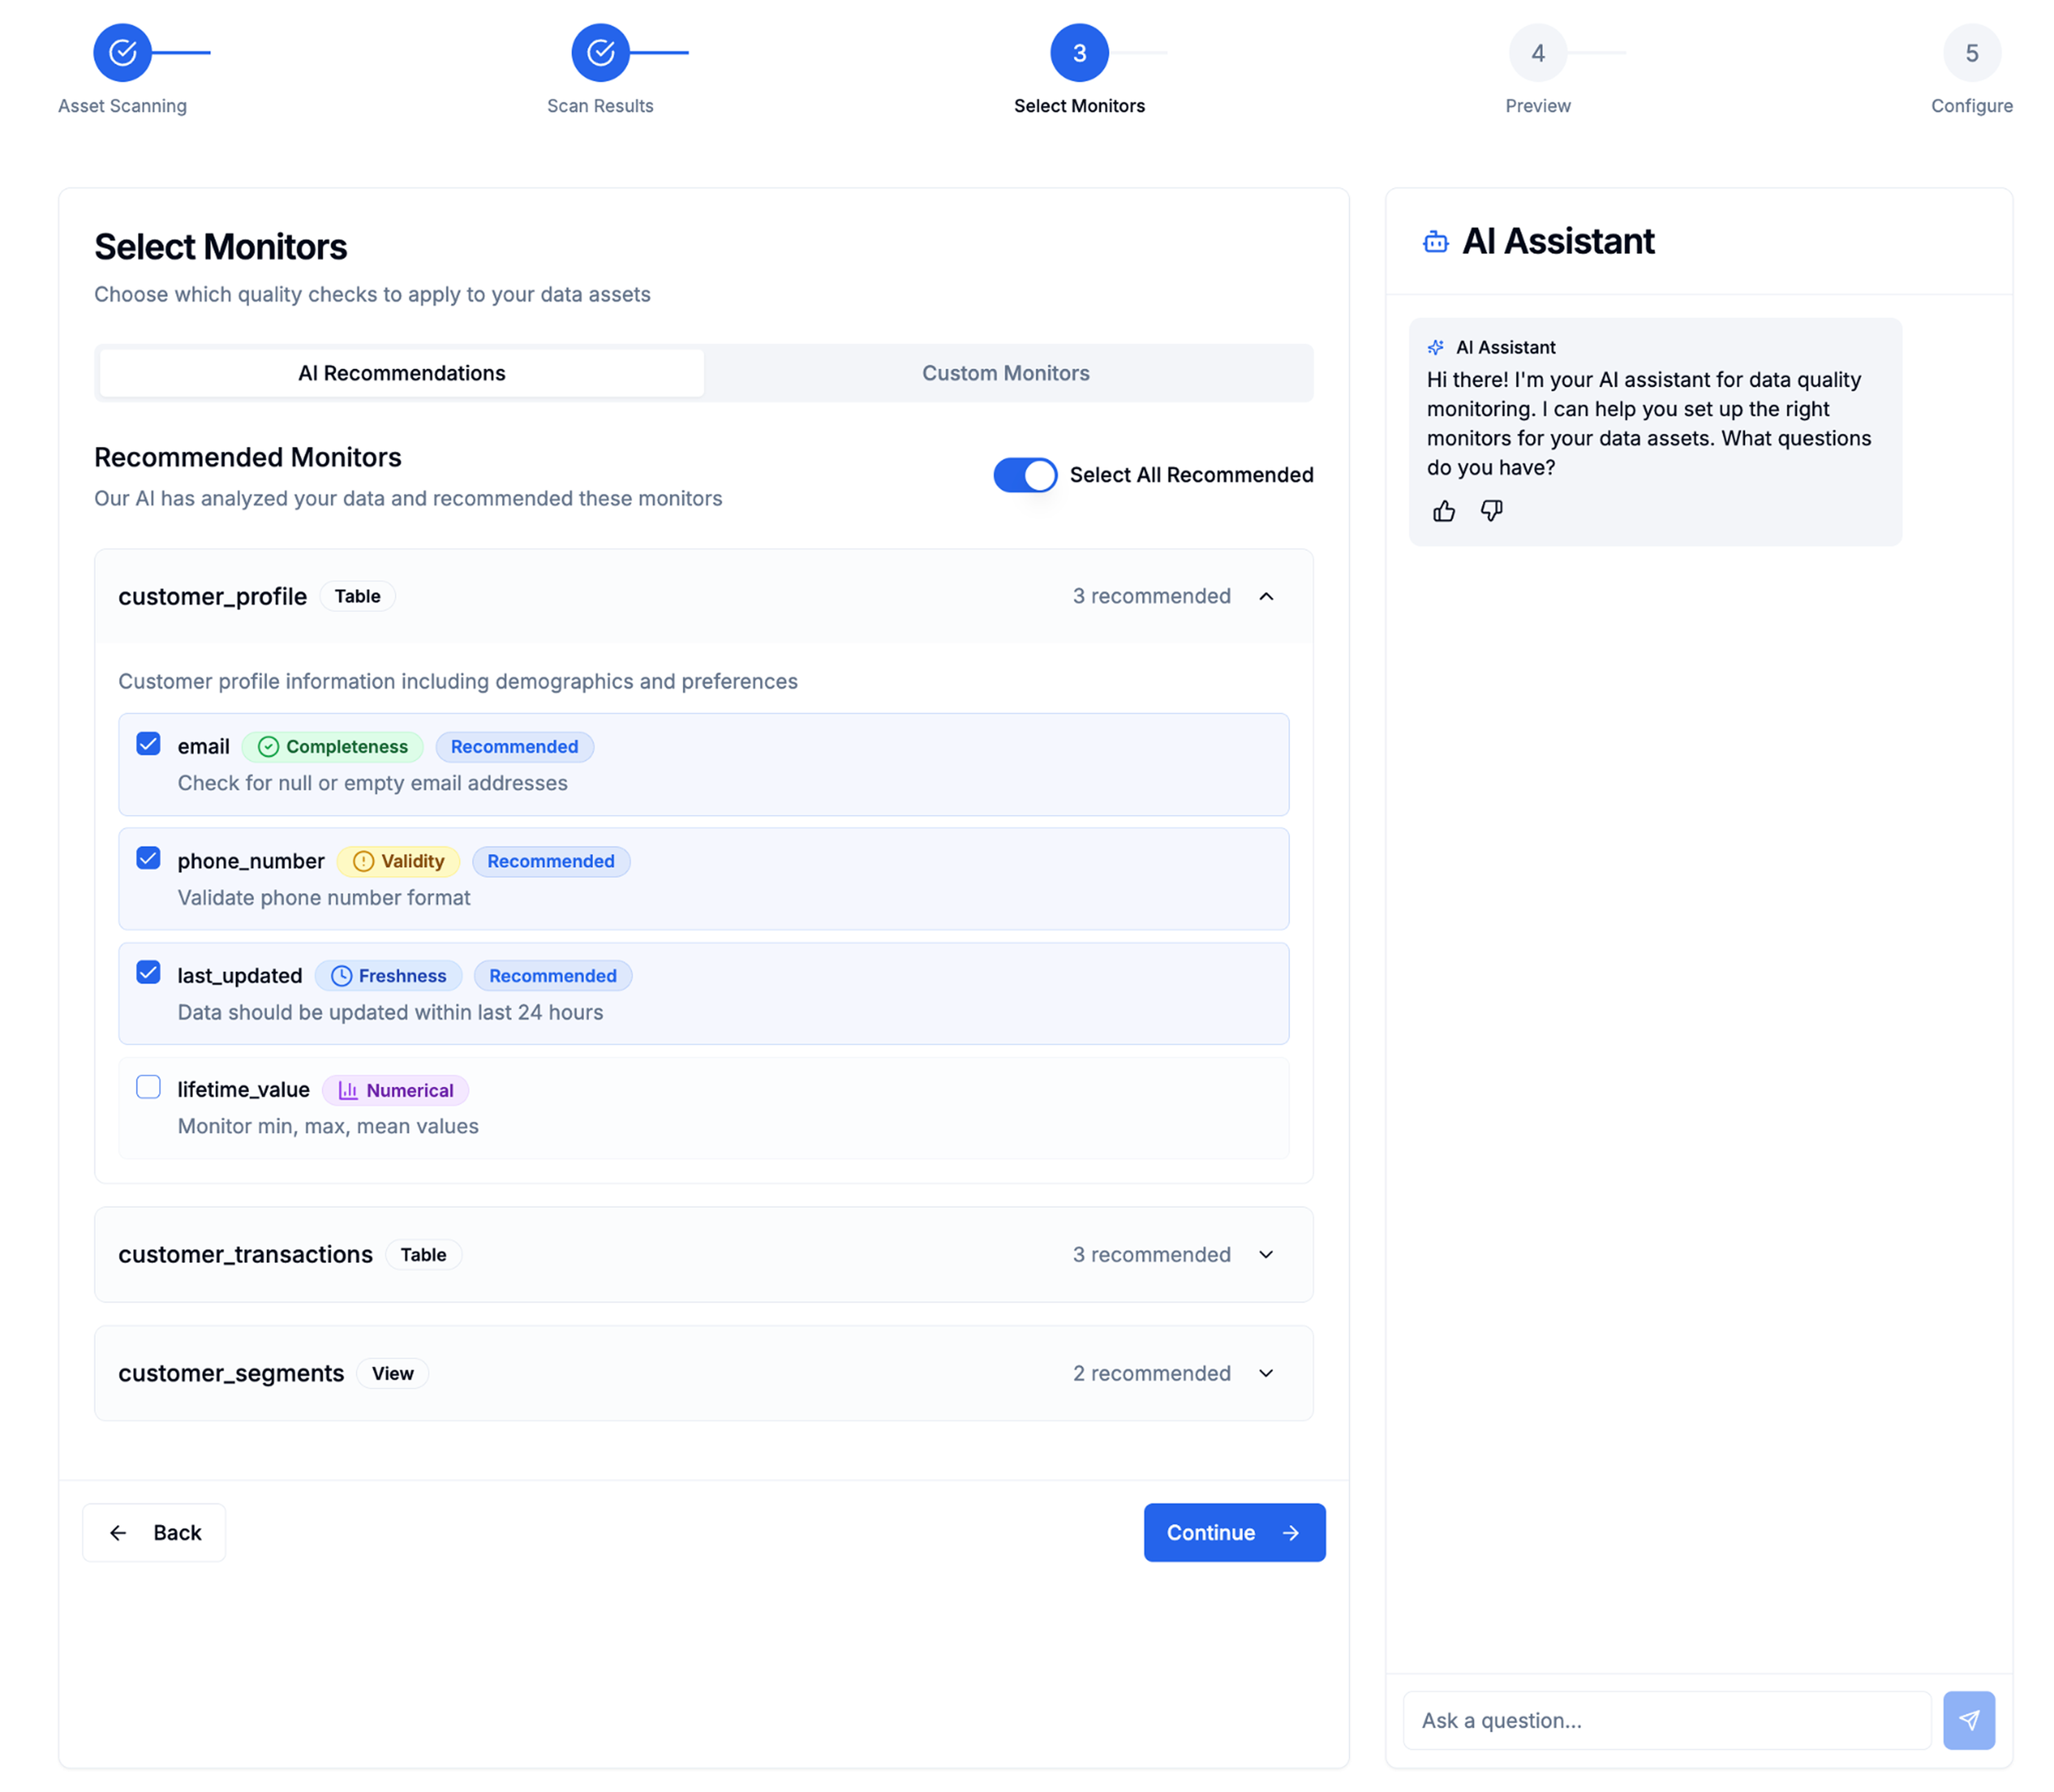
Instead, I designed AI support as profiling-based recommendations embedded in the existing workflow. The system analyzes real data — actual distributions, patterns, and anomalies in the customer's tables — and recommends checks grounded in what the data actually looks like. Recommendations appear as opt-in suggestions alongside manual check creation: users can accept, modify, or ignore them entirely. The AI is a tool within the flow, not a separate interface to learn.
Users got the benefit of intelligent automation without sacrificing the control and transparency they require. Customer feedback validated the approach — the AI felt helpful rather than intrusive, and adoption was higher precisely because it was optional. This also established a precedent for how Alation integrates AI across the product: embedded, evidence-based, and always under the user's control.
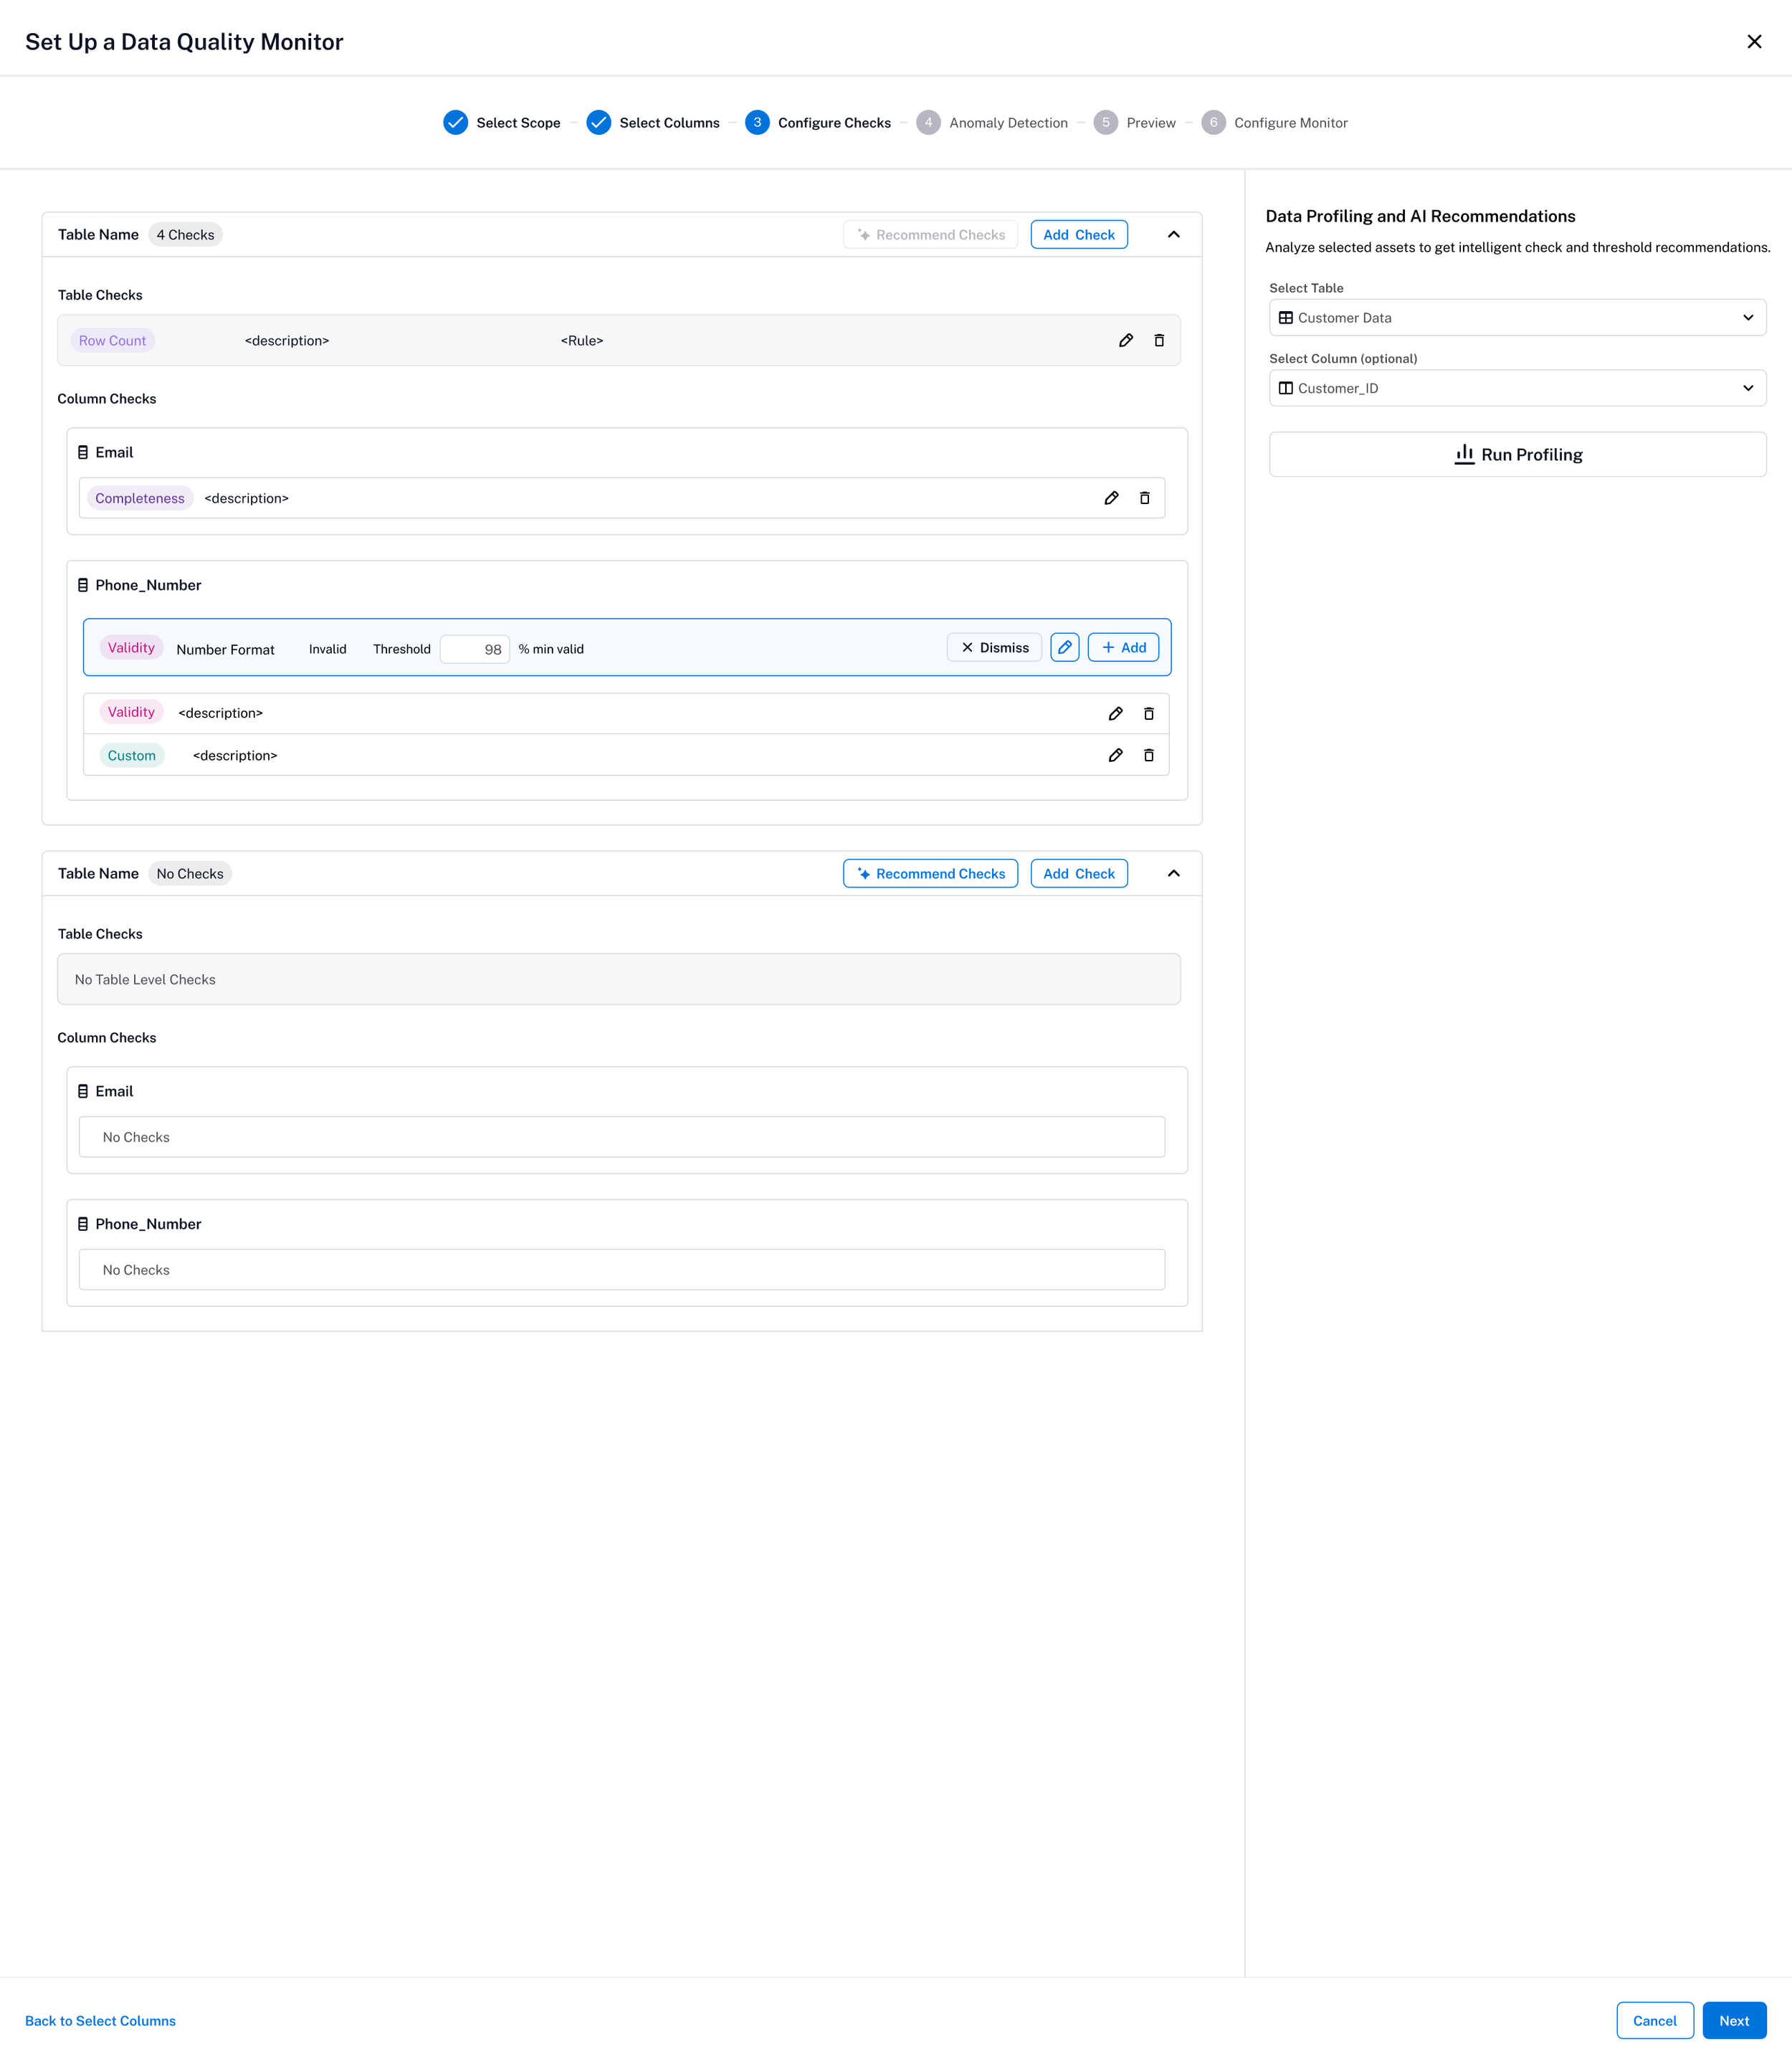
Recommended Checks based on profiled data
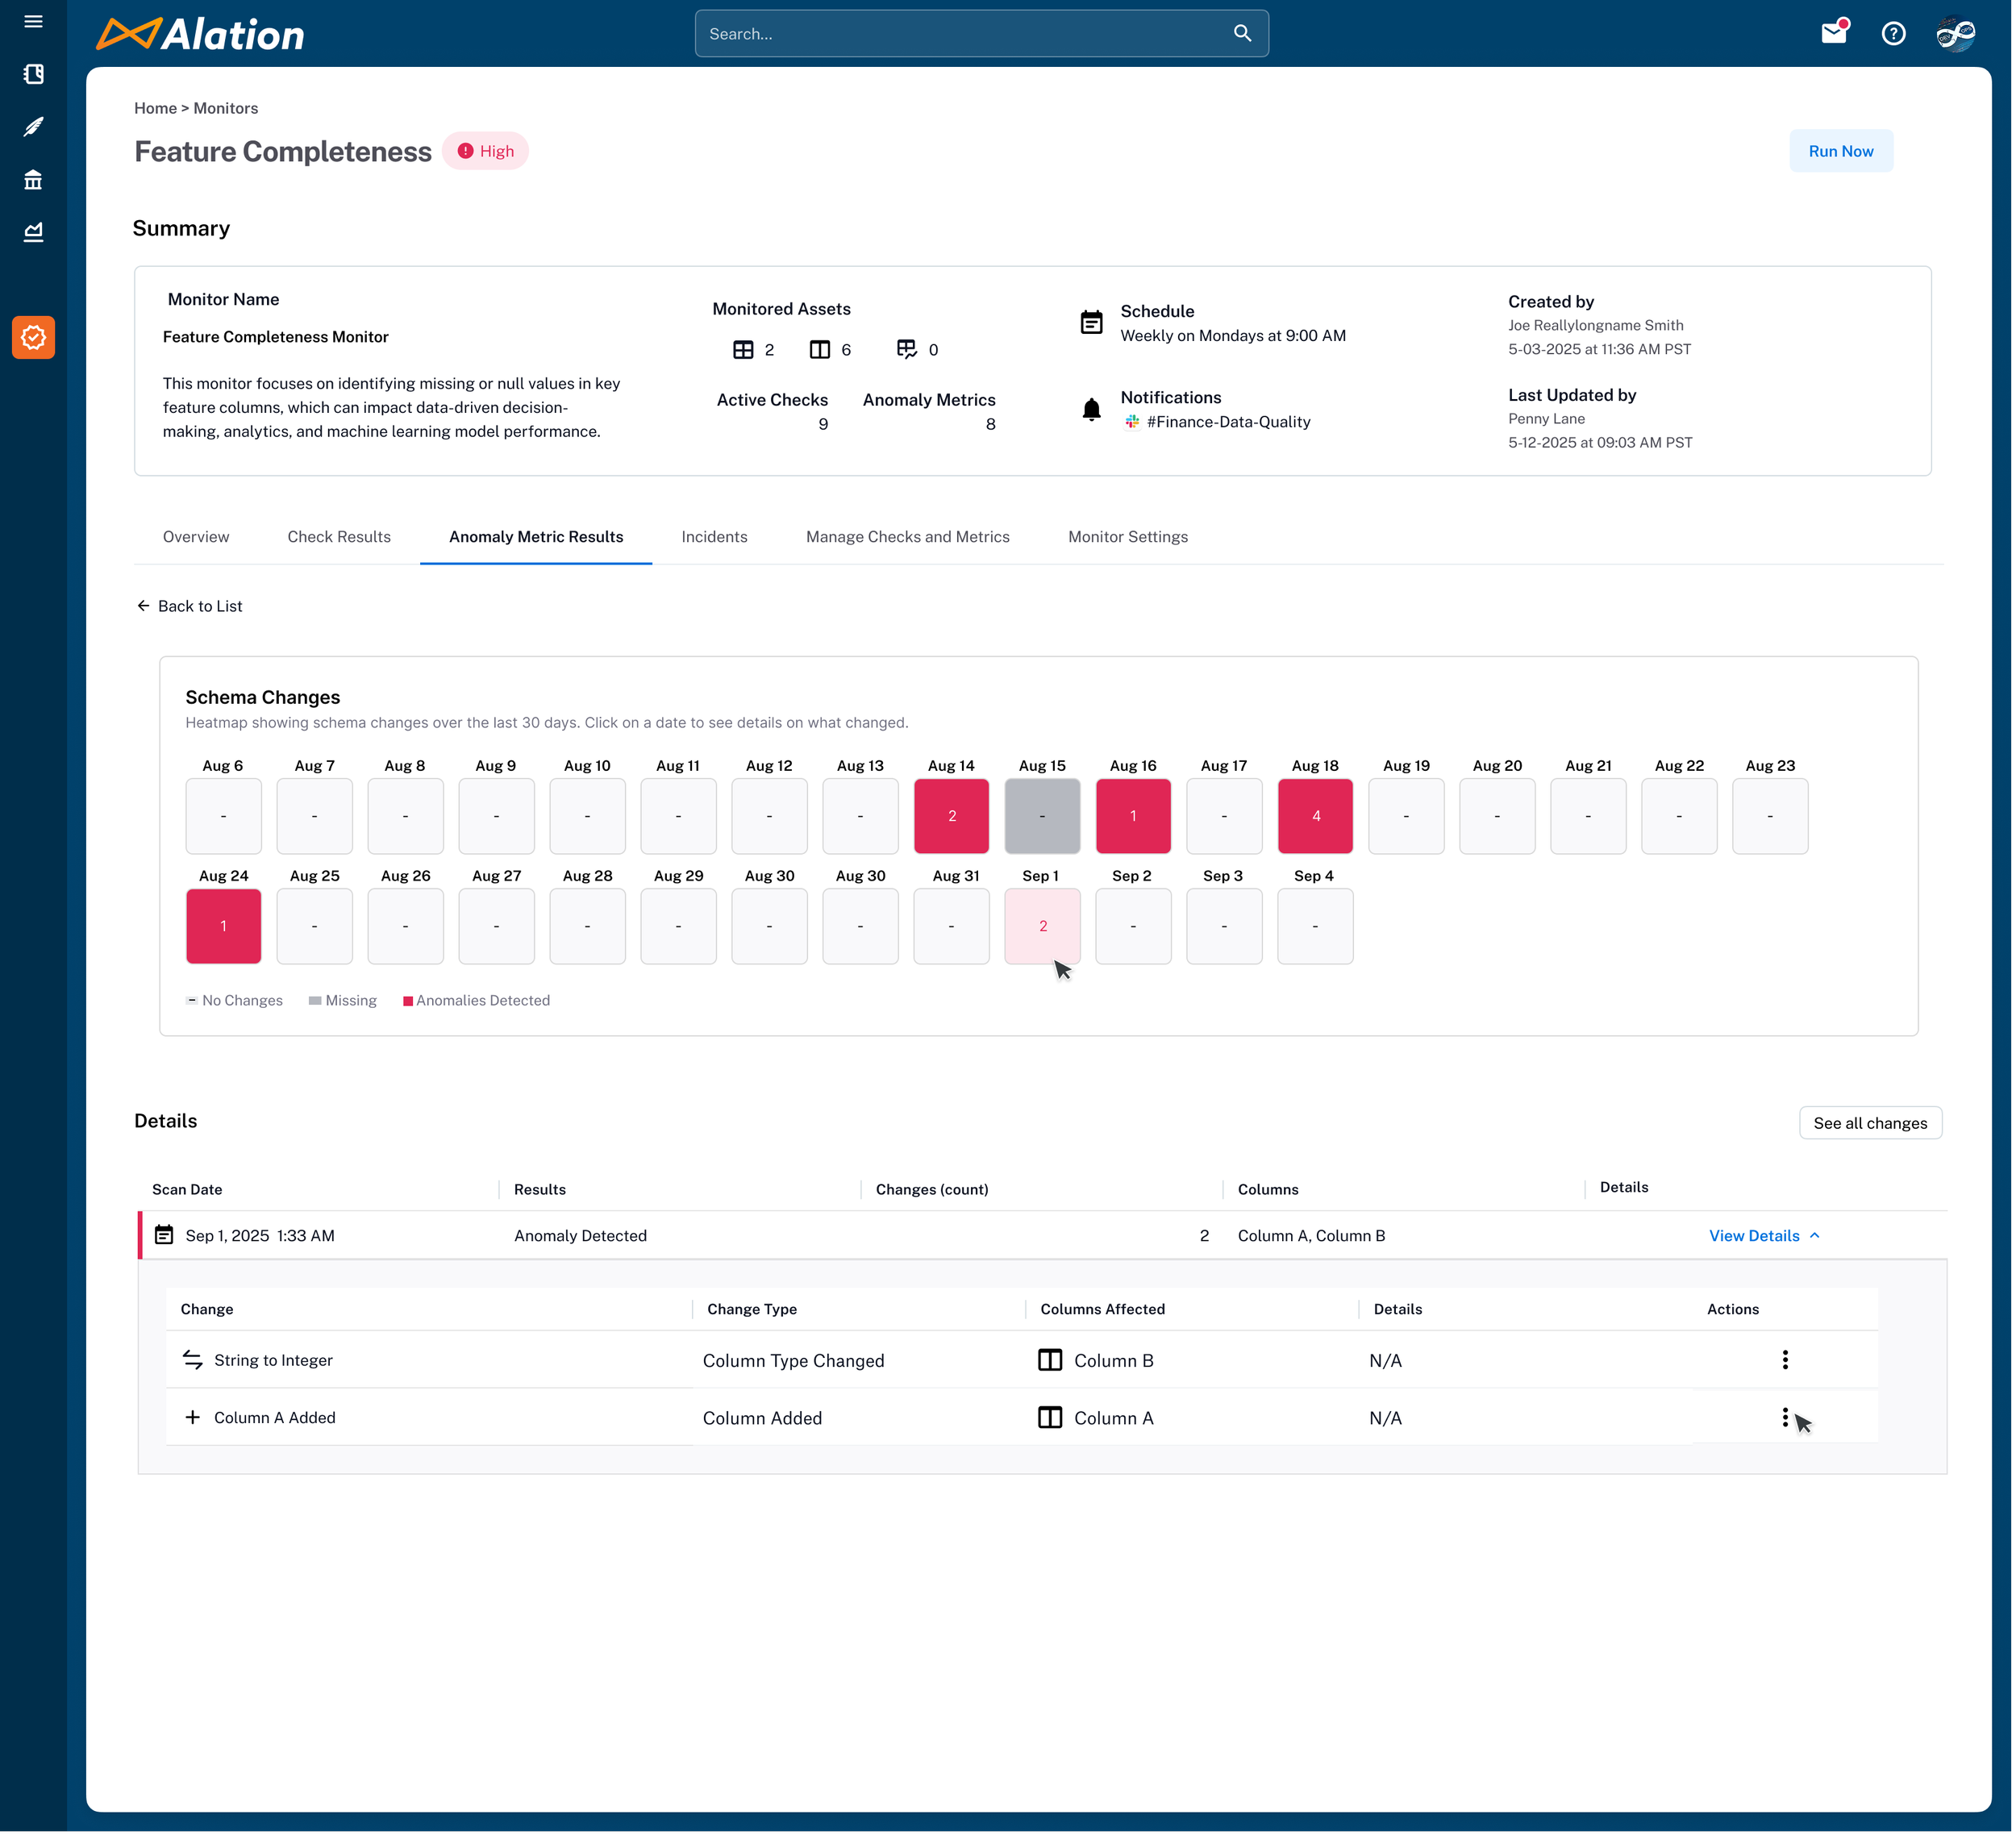
3. Anomaly Detection — Embedded, Not Bolted On
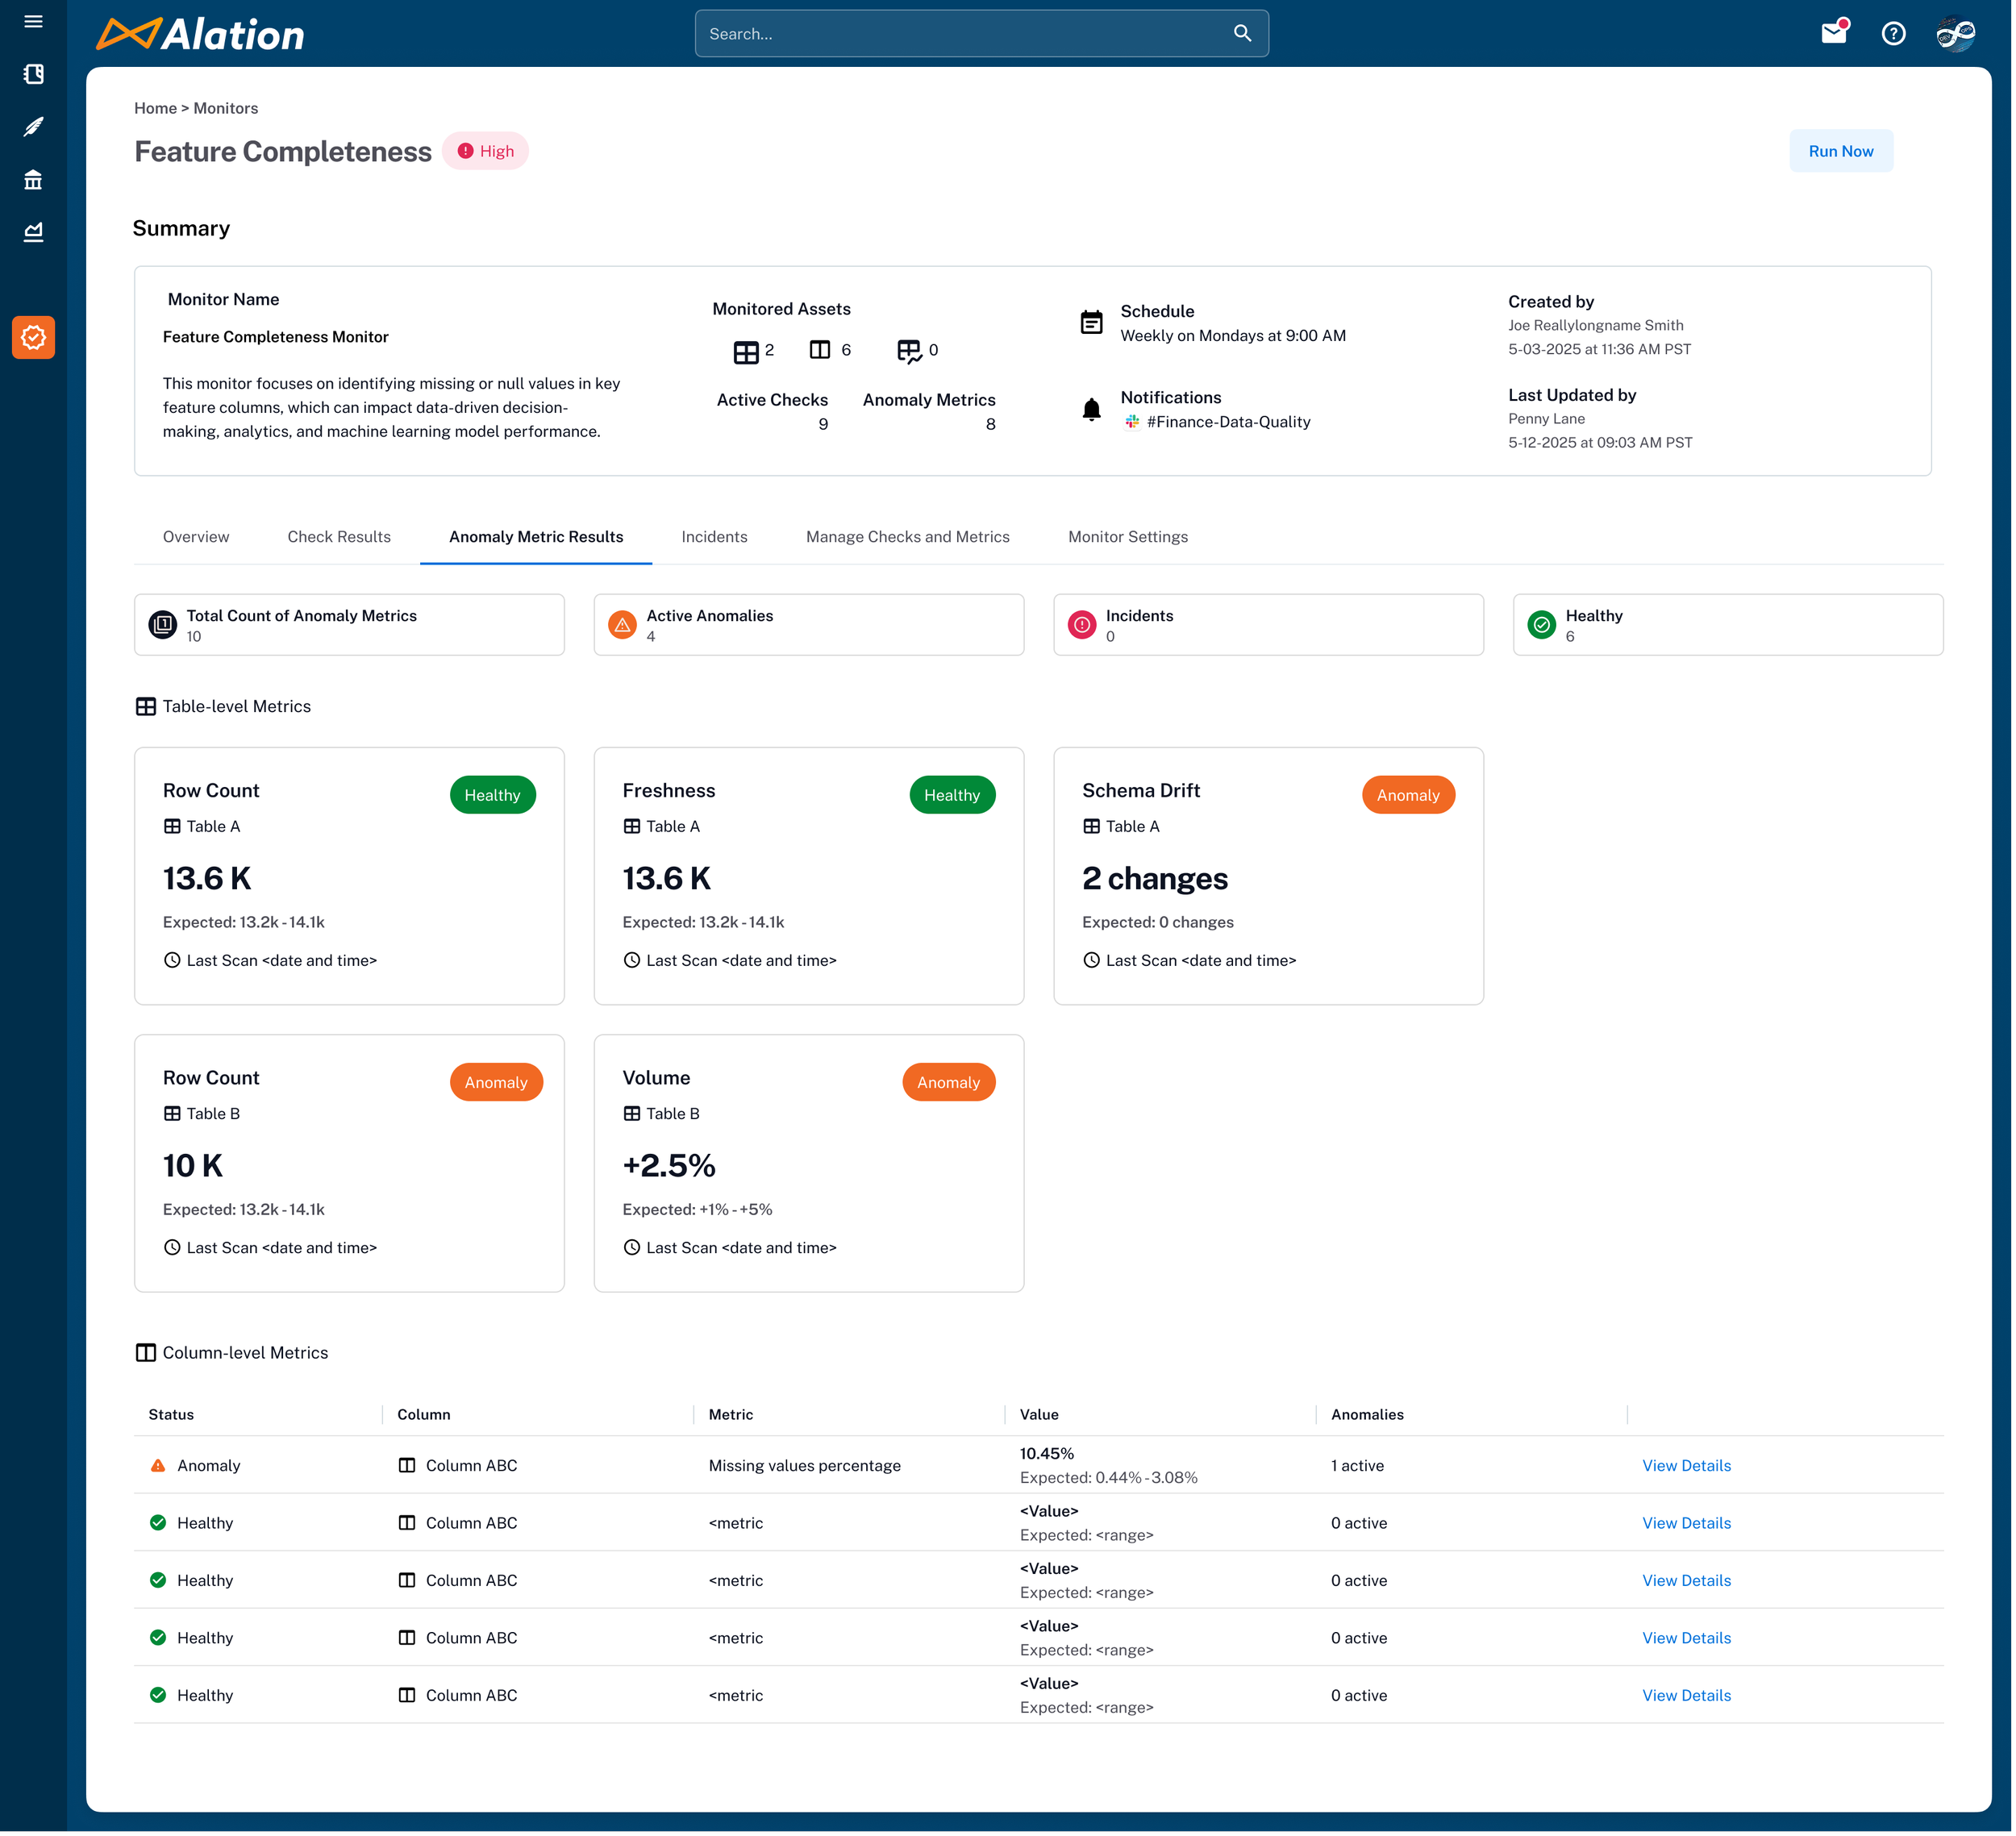
Users think about anomalies at the table level — "is something wrong with this table?" But configuring anomaly detection table-by-table doesn't scale, and it fragments scheduling and governance. We needed anomaly detection to live where the rest of the quality work already happened.
I embedded anomaly detection inside the monitor, operating at the monitor level even when the monitor spans multiple tables. This meant a single monitor could run both rule-based checks and anomaly detection on the same assets, with unified scheduling and governance. Users configure it once alongside their checks rather than managing a separate anomaly tool.
It unified two signal types — "does this data follow the rules?" (checks) and "is this data behaving unusually?" (anomalies) — into one view. This supports broader use cases, simplifies governance, and gives users a single surface to understand the full health of their data rather than cross-referencing separate tools.
-
![]()
Anomaly Landing Page
-
![]()
Detailed Look at Schema Changes / Drift
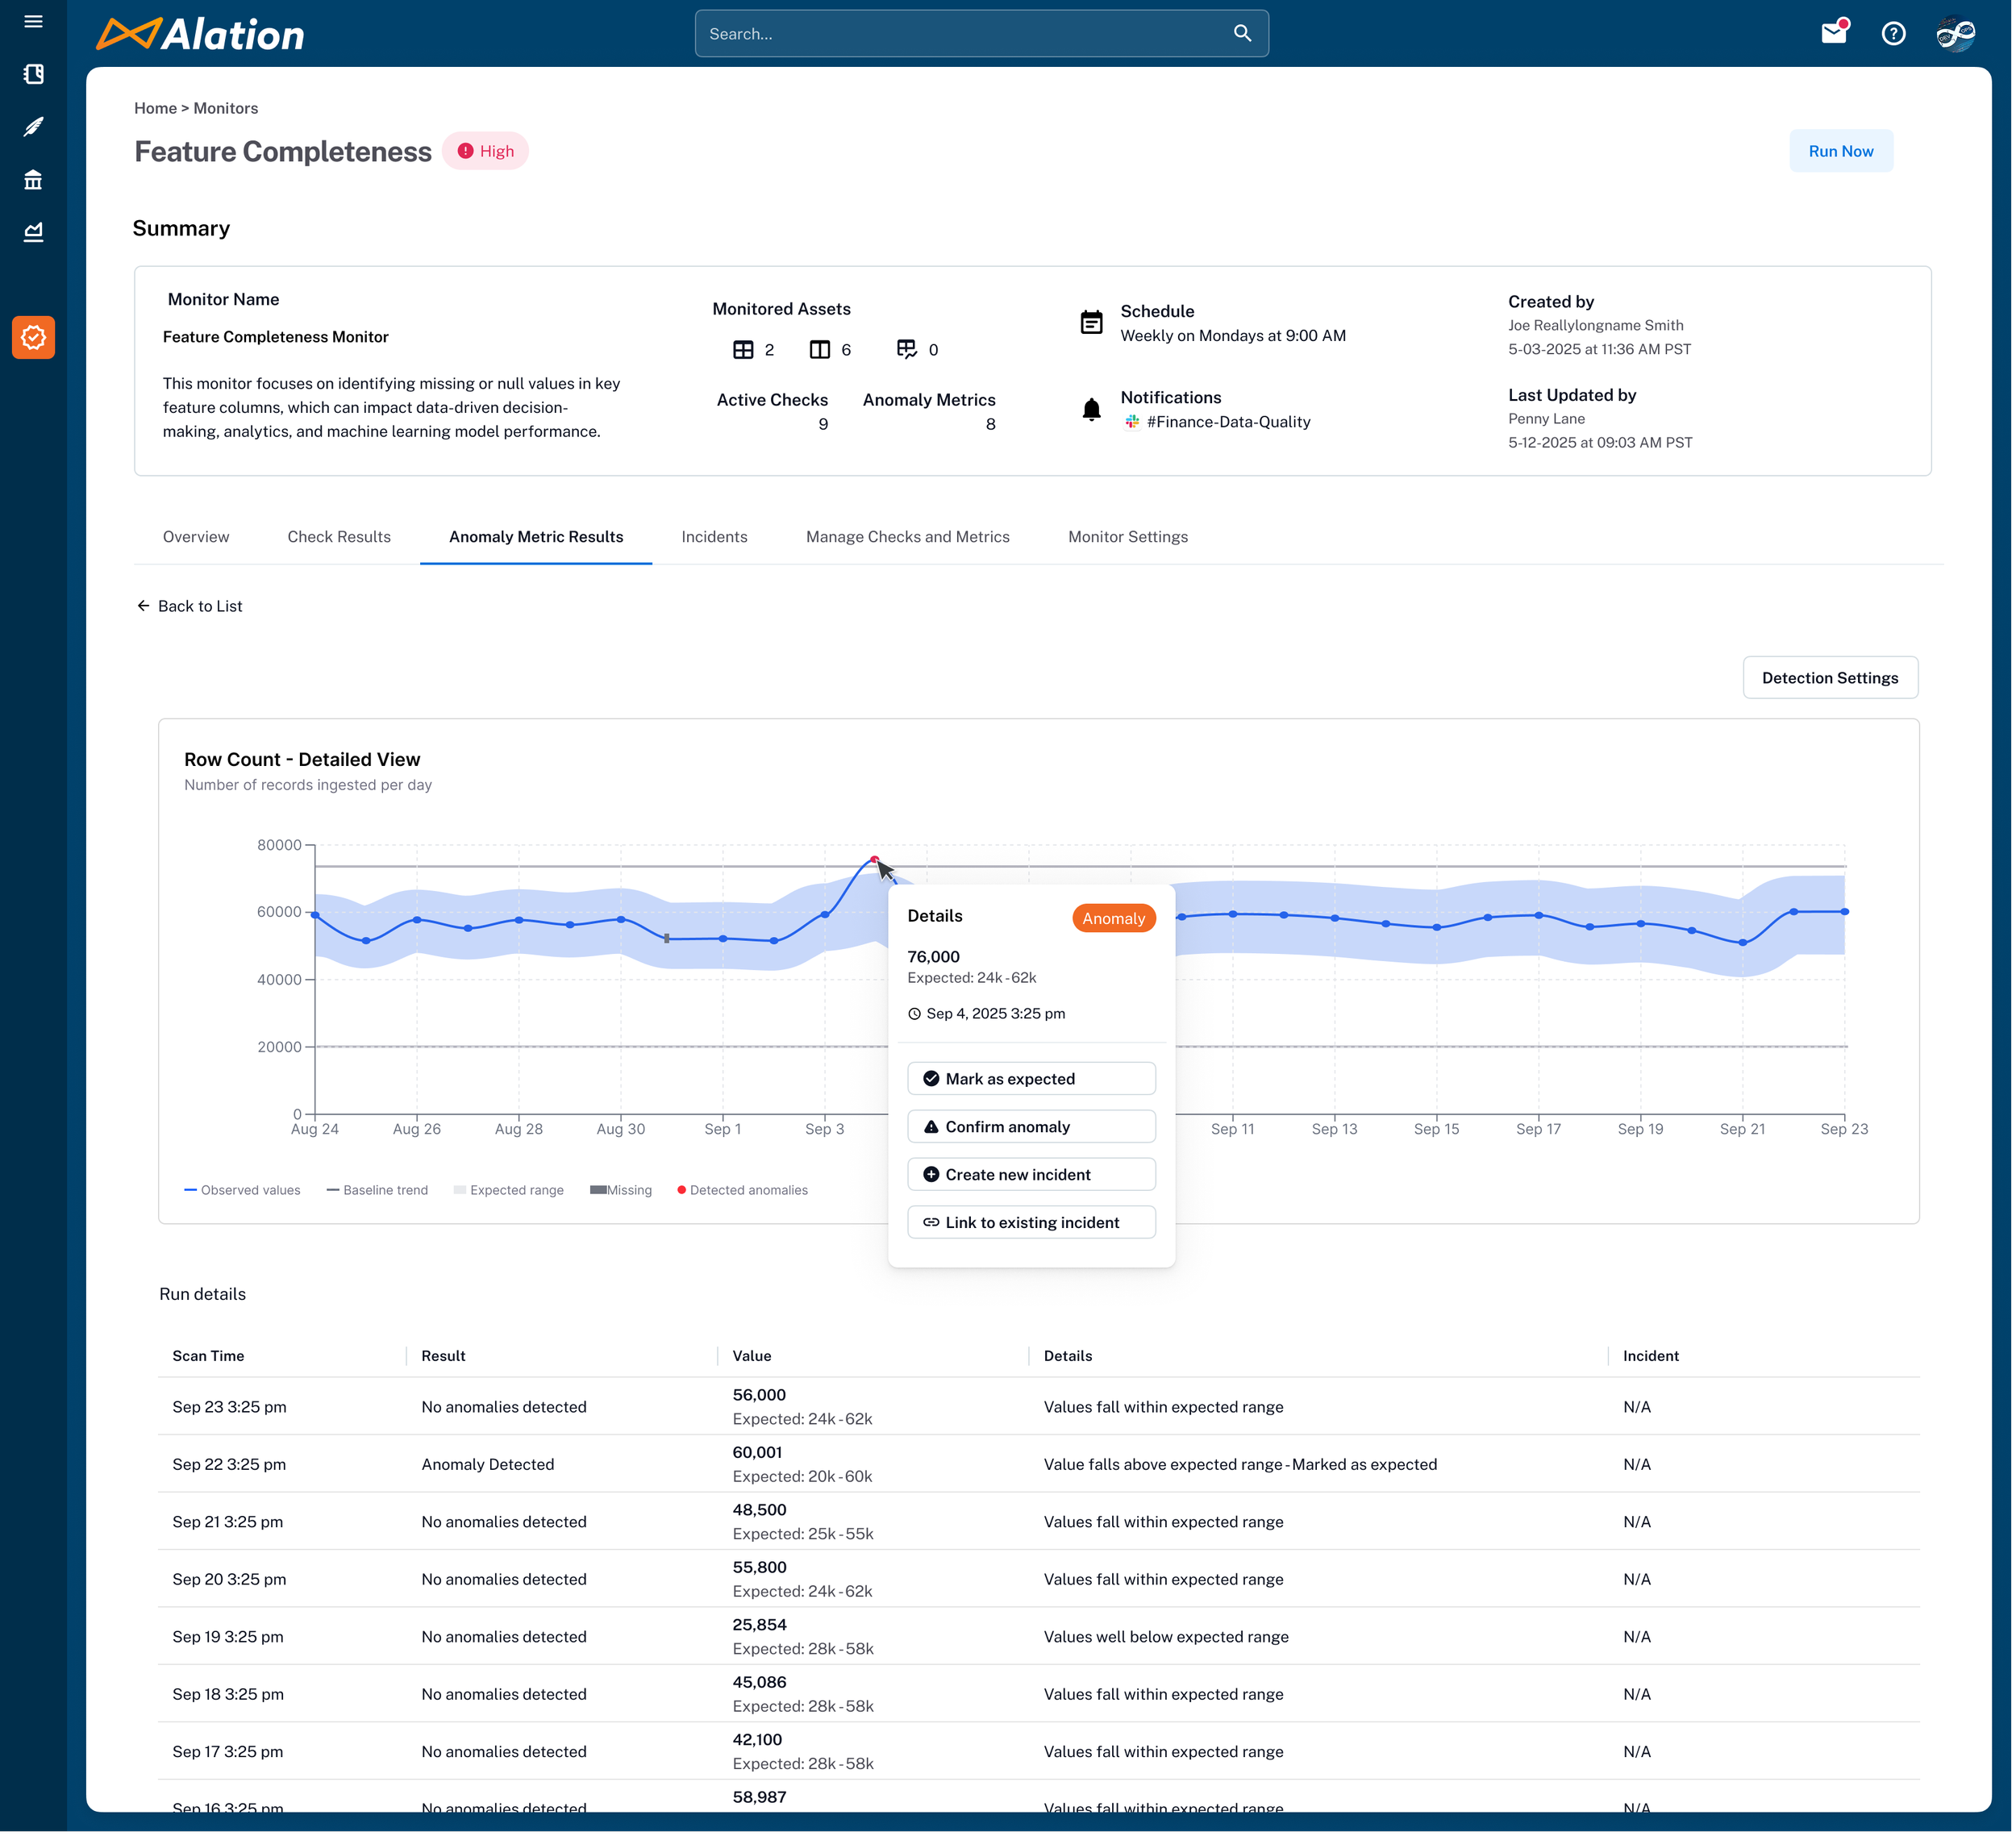
-
![]()
Detailed look at time-series data for anomaly analysis
Incidents & the Remediation Boundary
A failing check is a signal. A repeatedly failing check is an incident — something that needs to be tracked, assigned, and resolved. Without a way to escalate persistent failures into existing workflows, quality alerts became noise that teams learned to ignore.
I designed an incident management layer that surfaces repeat failures as trackable incidents and integrates with Jira and ServiceNow. When a check fails consistently, the system creates an incident with full context — which monitor, which asset, which rule, failure history — and pushes it into the team's existing ticketing workflow rather than asking them to adopt another triage surface.
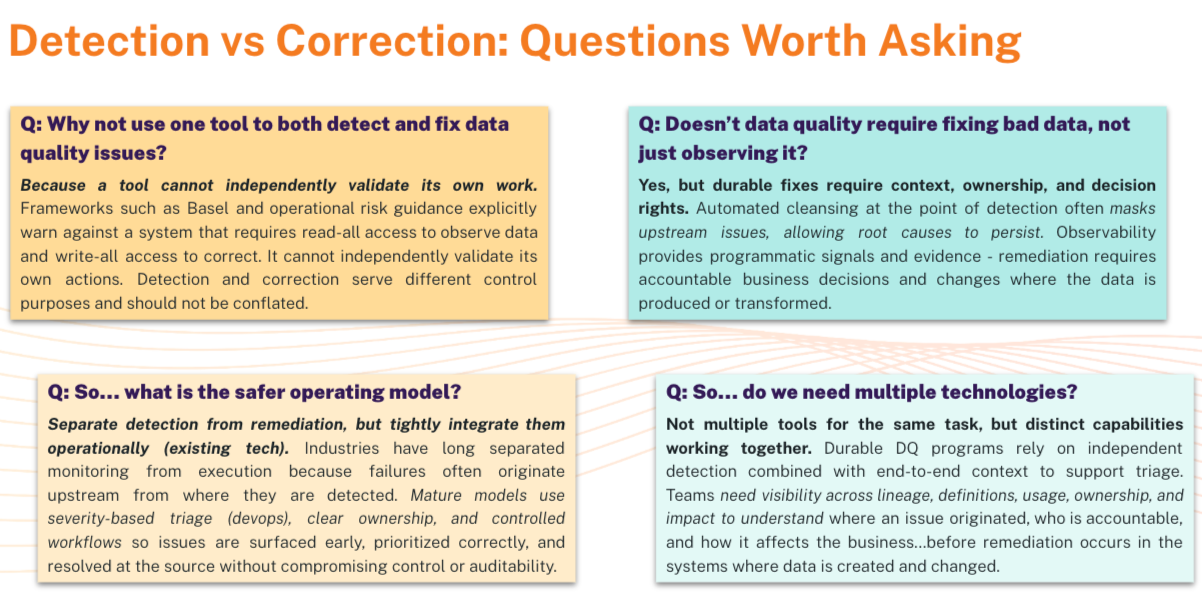
We deliberately stopped at detection and tracking — not remediation. Two reasons: Alation sits at the catalog layer, not the data source layer, so we lacked the deep infrastructure access needed to actually fix a broken pipeline or backfill missing values. And our research was unambiguous — users were not ready for an AI agent that could modify their data. The same stewards who welcomed AI suggesting checks and surfacing potential errors drew a hard line at automated resolution.
This reinforced a principle that ran through the entire product: AI assists, humans decide. The system can suggest checks based on profiled data, flag potential errors, create an incident, and route it to the right team. But the moment you cross into changing data, you need a human in the loop — not because the AI isn't capable, but because the trust isn't there yet. Designing for where users actually are is what makes enterprise products get adopted.
Incident page: shows the failed checks, details on the failed rows, and linked to JIRA or Servicenow
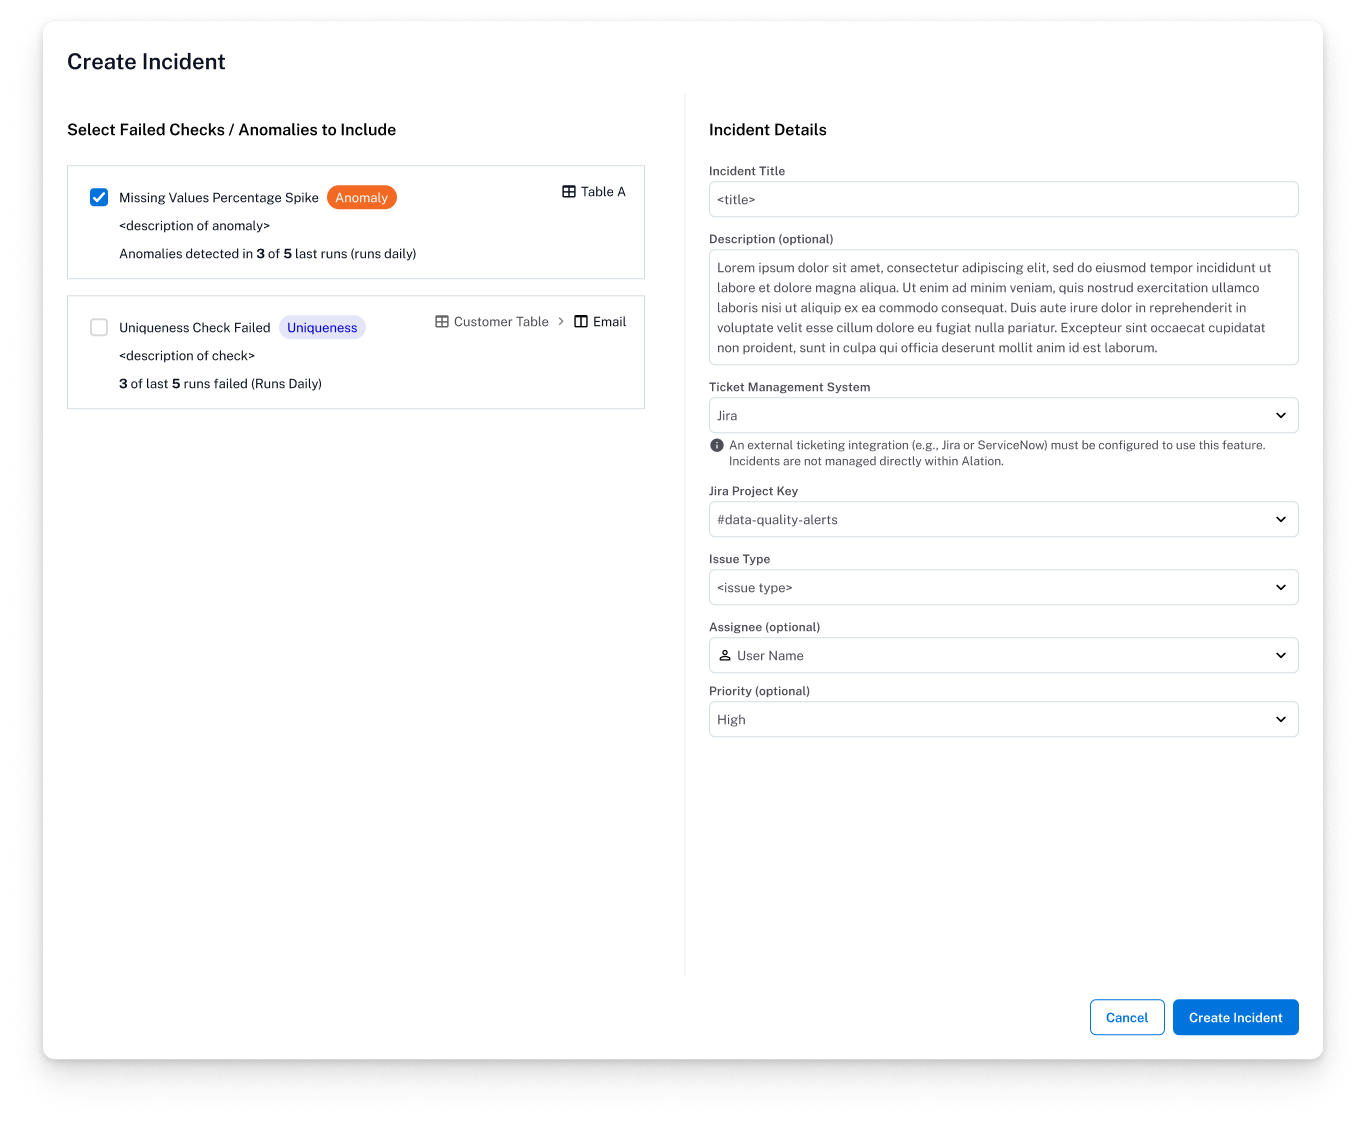
Incident creation modal: link failed checks and anomalies into an incident ticket for tracking.
Sample failed rows, detailing what caused a data quality check failure. “Run correlation analysis” is a way to determine the potential causes of the failure.
-
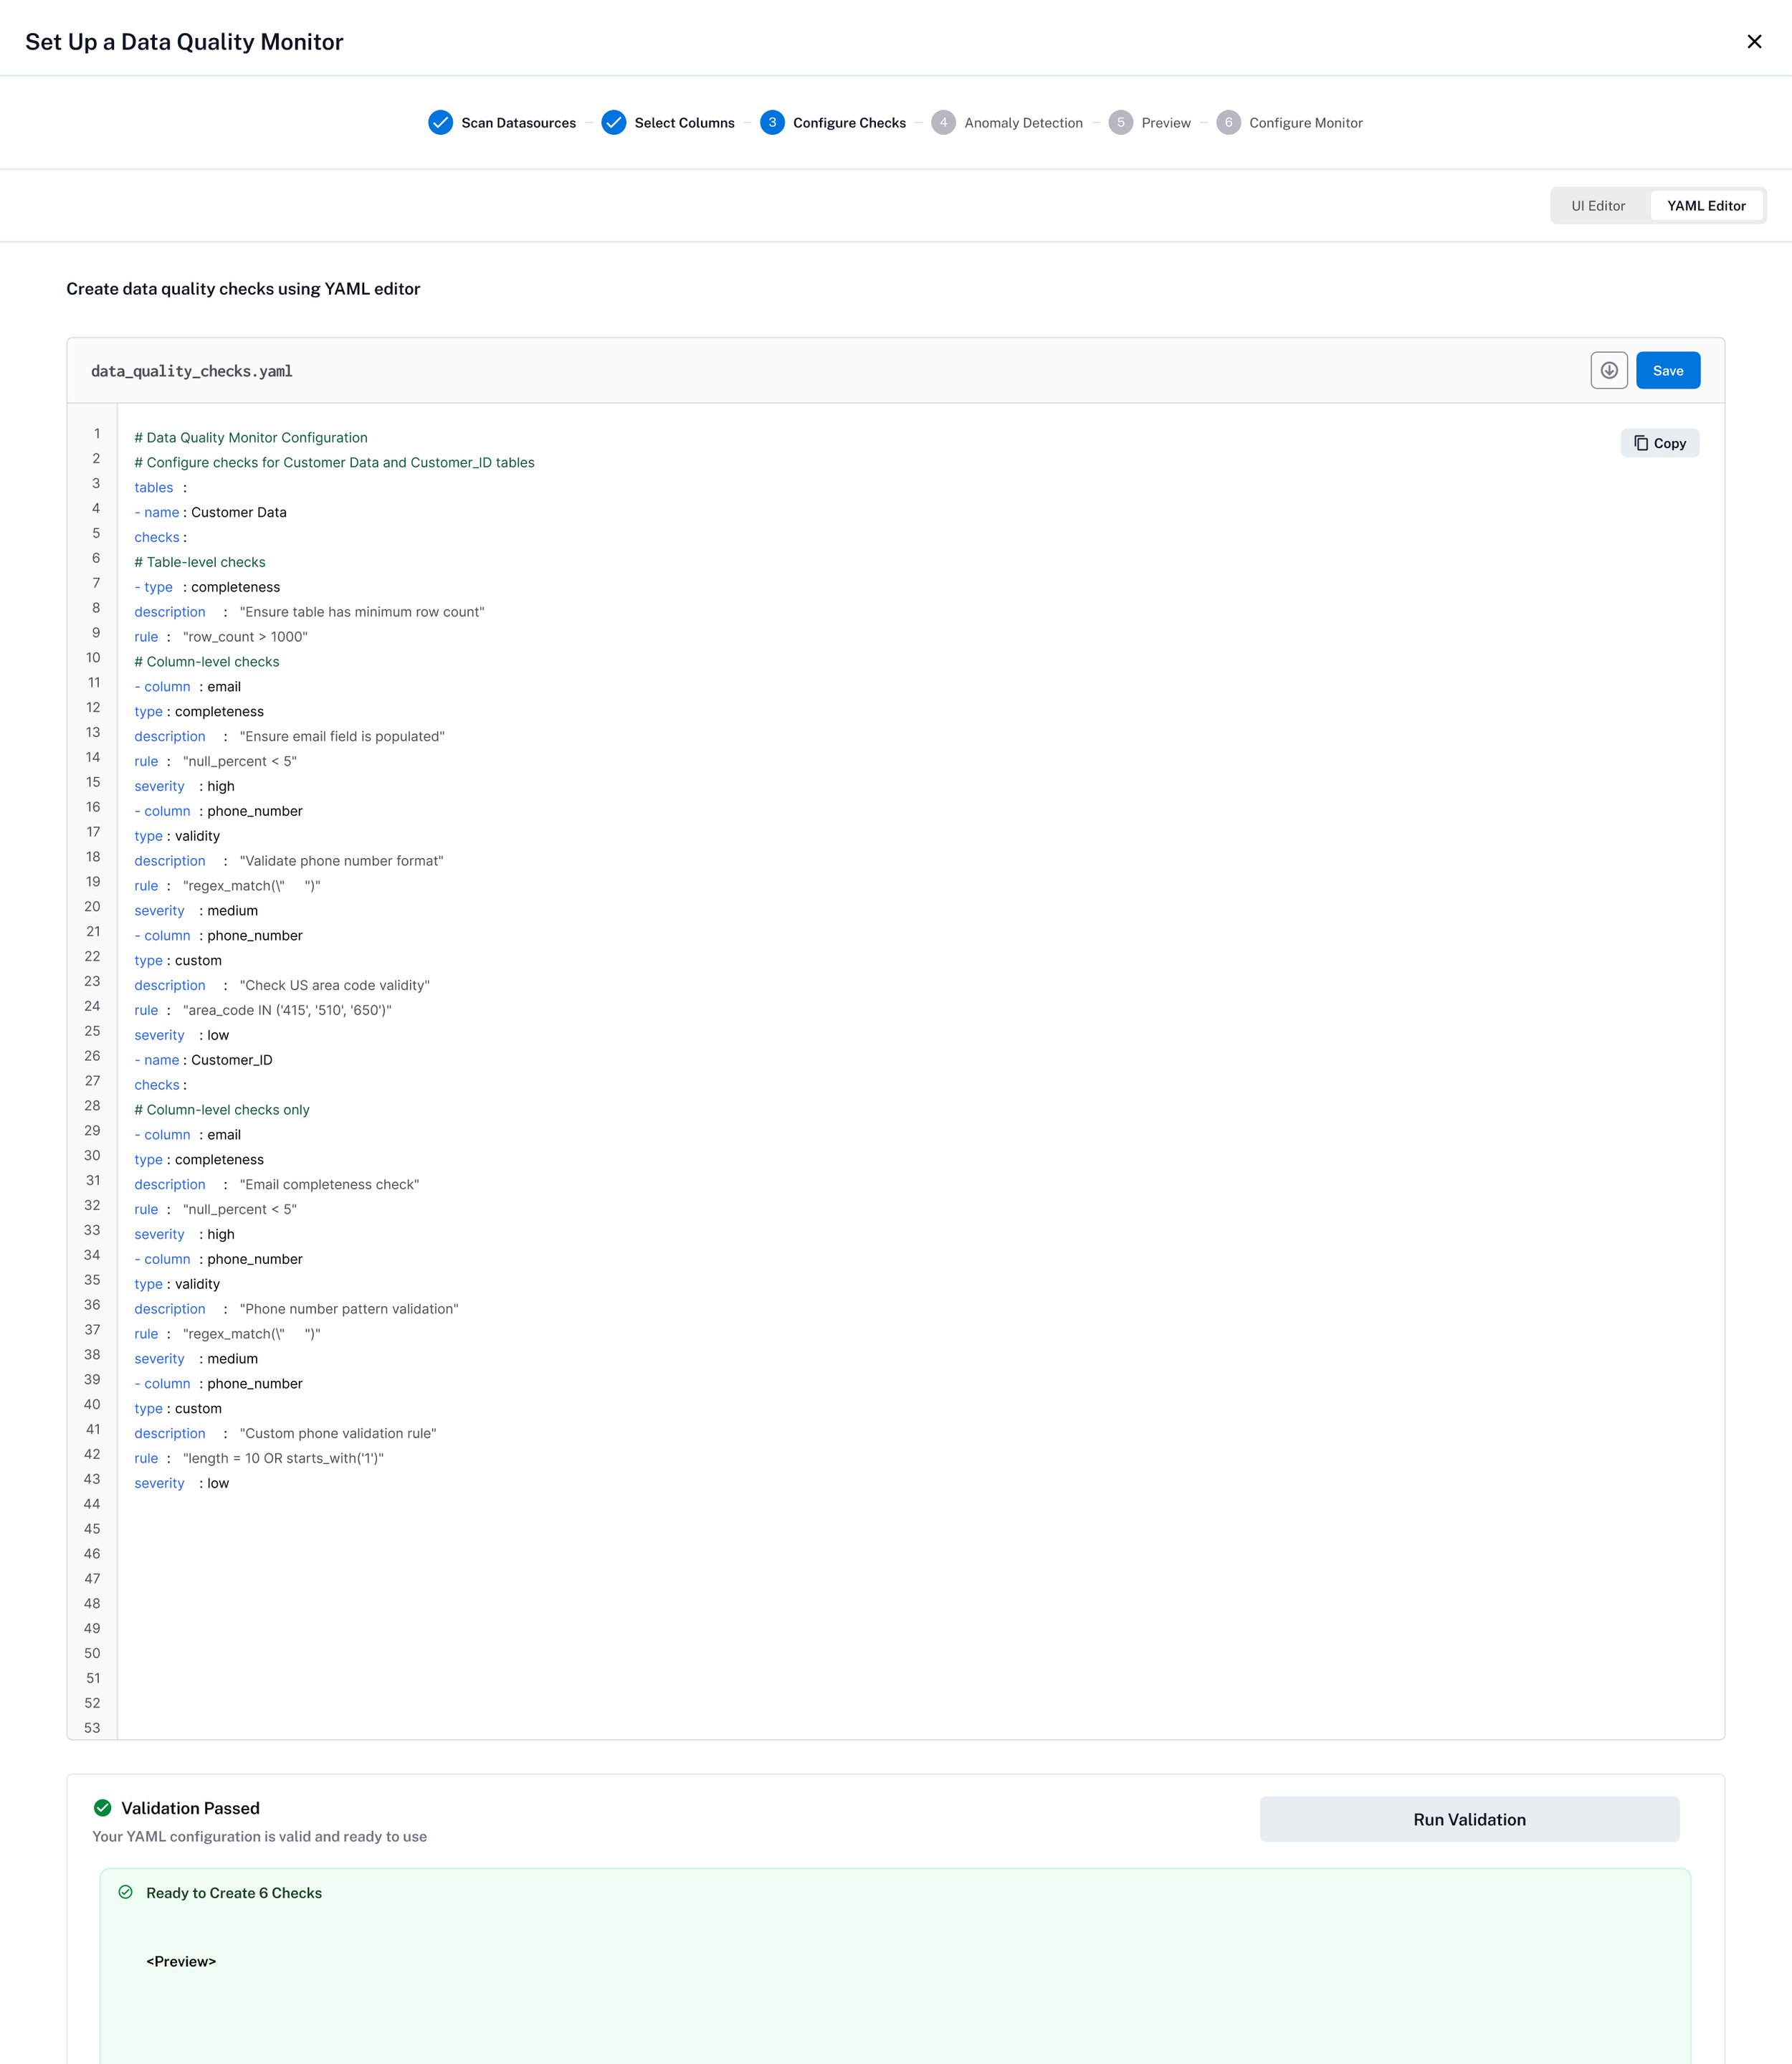
YAML Editor
Enabling our technical users to create Data Quality checks using a more familiar YAML format. Changes in YAML are reflected in the UI and vice versa so users can switch between methods seamlessly.
-
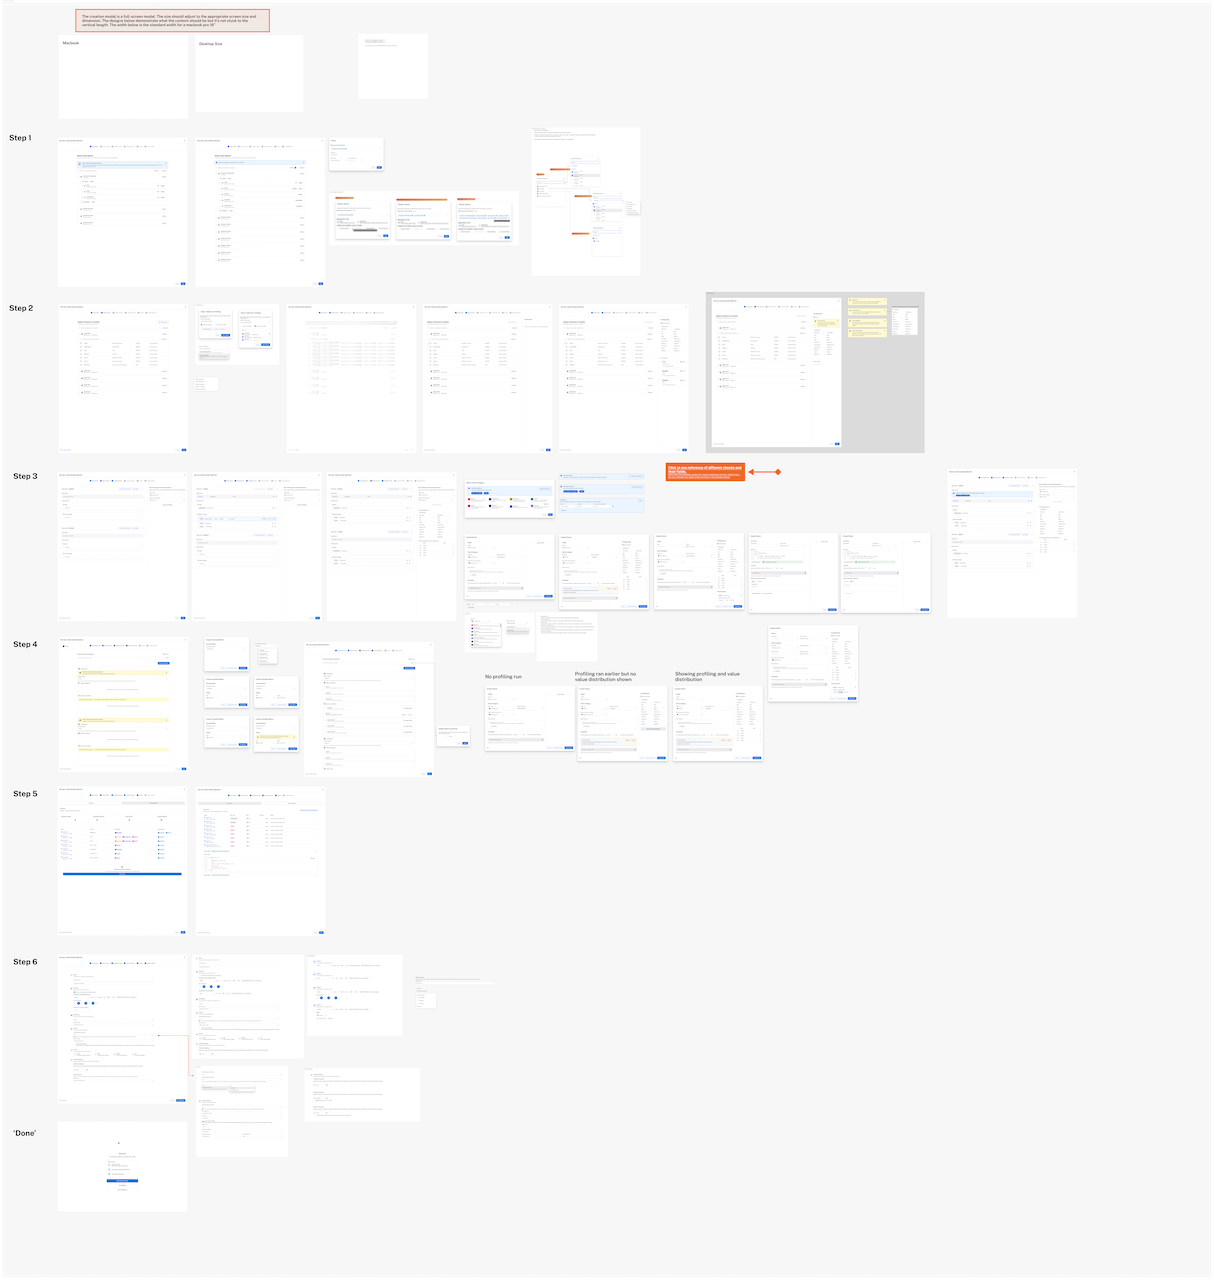
Detailed Flows and States
Each screen and state of experience are designed and annotated in Figma. Most of the engineering team was in a different time zone so we leveraged Figma for clear design annotations and the to review comments and questions asynchronously.
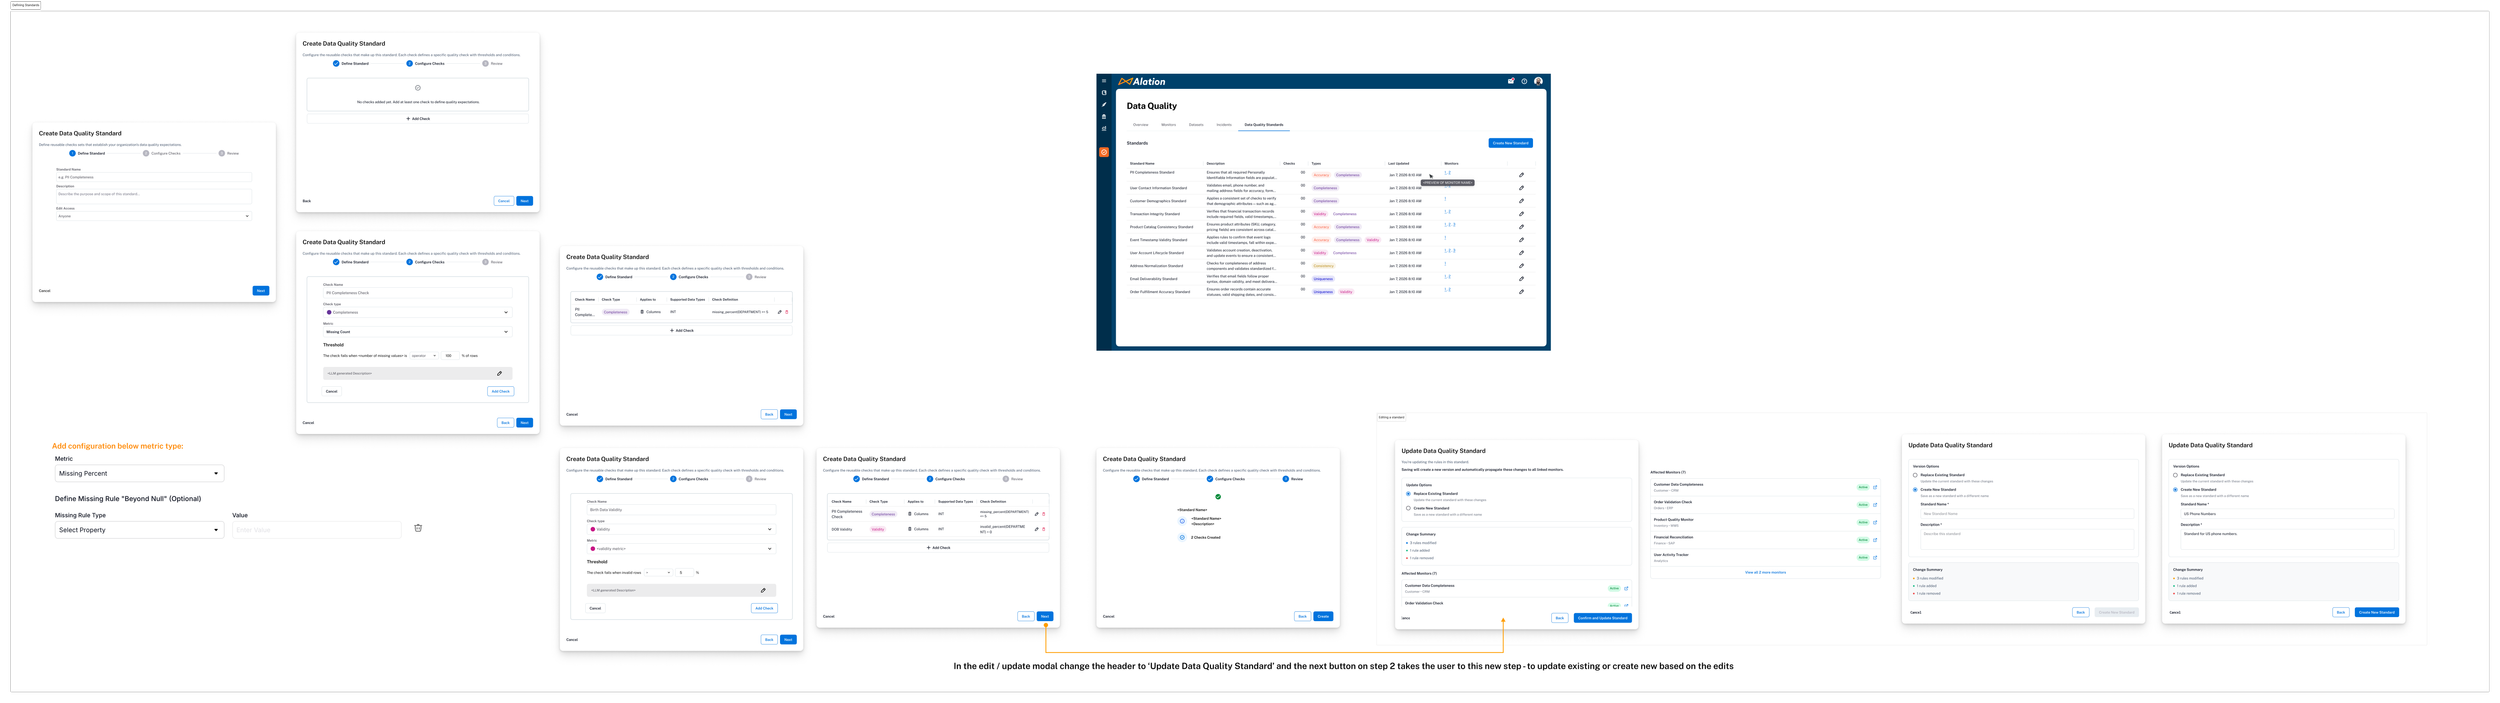
Standards — Templates That Scale Governance
Standards needed to solve two distinct pain points. Internally, we needed to combine data quality rules and Critical Data Element monitoring into one coherent workflow. Externally, customers needed a way to apply rules in bulk rather than configuring checks one asset at a time.
I designed Standards as reusable templates: a more data-savvy persona defines the rules, and less technical users apply them to the data they care about — in this case, critical data elements. For bulk application, if a user wants to monitor all userID columns across their data estate, they define a template and mass-apply it to every column matching the criteria. This created two complementary entry points: select a template and apply it to all matching data points, or select specific data points and mix different check types — including AI-recommended checks based on profiled data.
Standards bridged the gap between data-savvy governance teams and the broader organization. The template model turned months of manual rule configuration into a repeatable, scalable workflow — while keeping the direct monitor flow available for users who needed hands-on, asset-specific control.
-
![]()
Overview of Standard Creation Flow
Detailing the steps to define, manage, and edit standards for Data Quality.
-
![]()
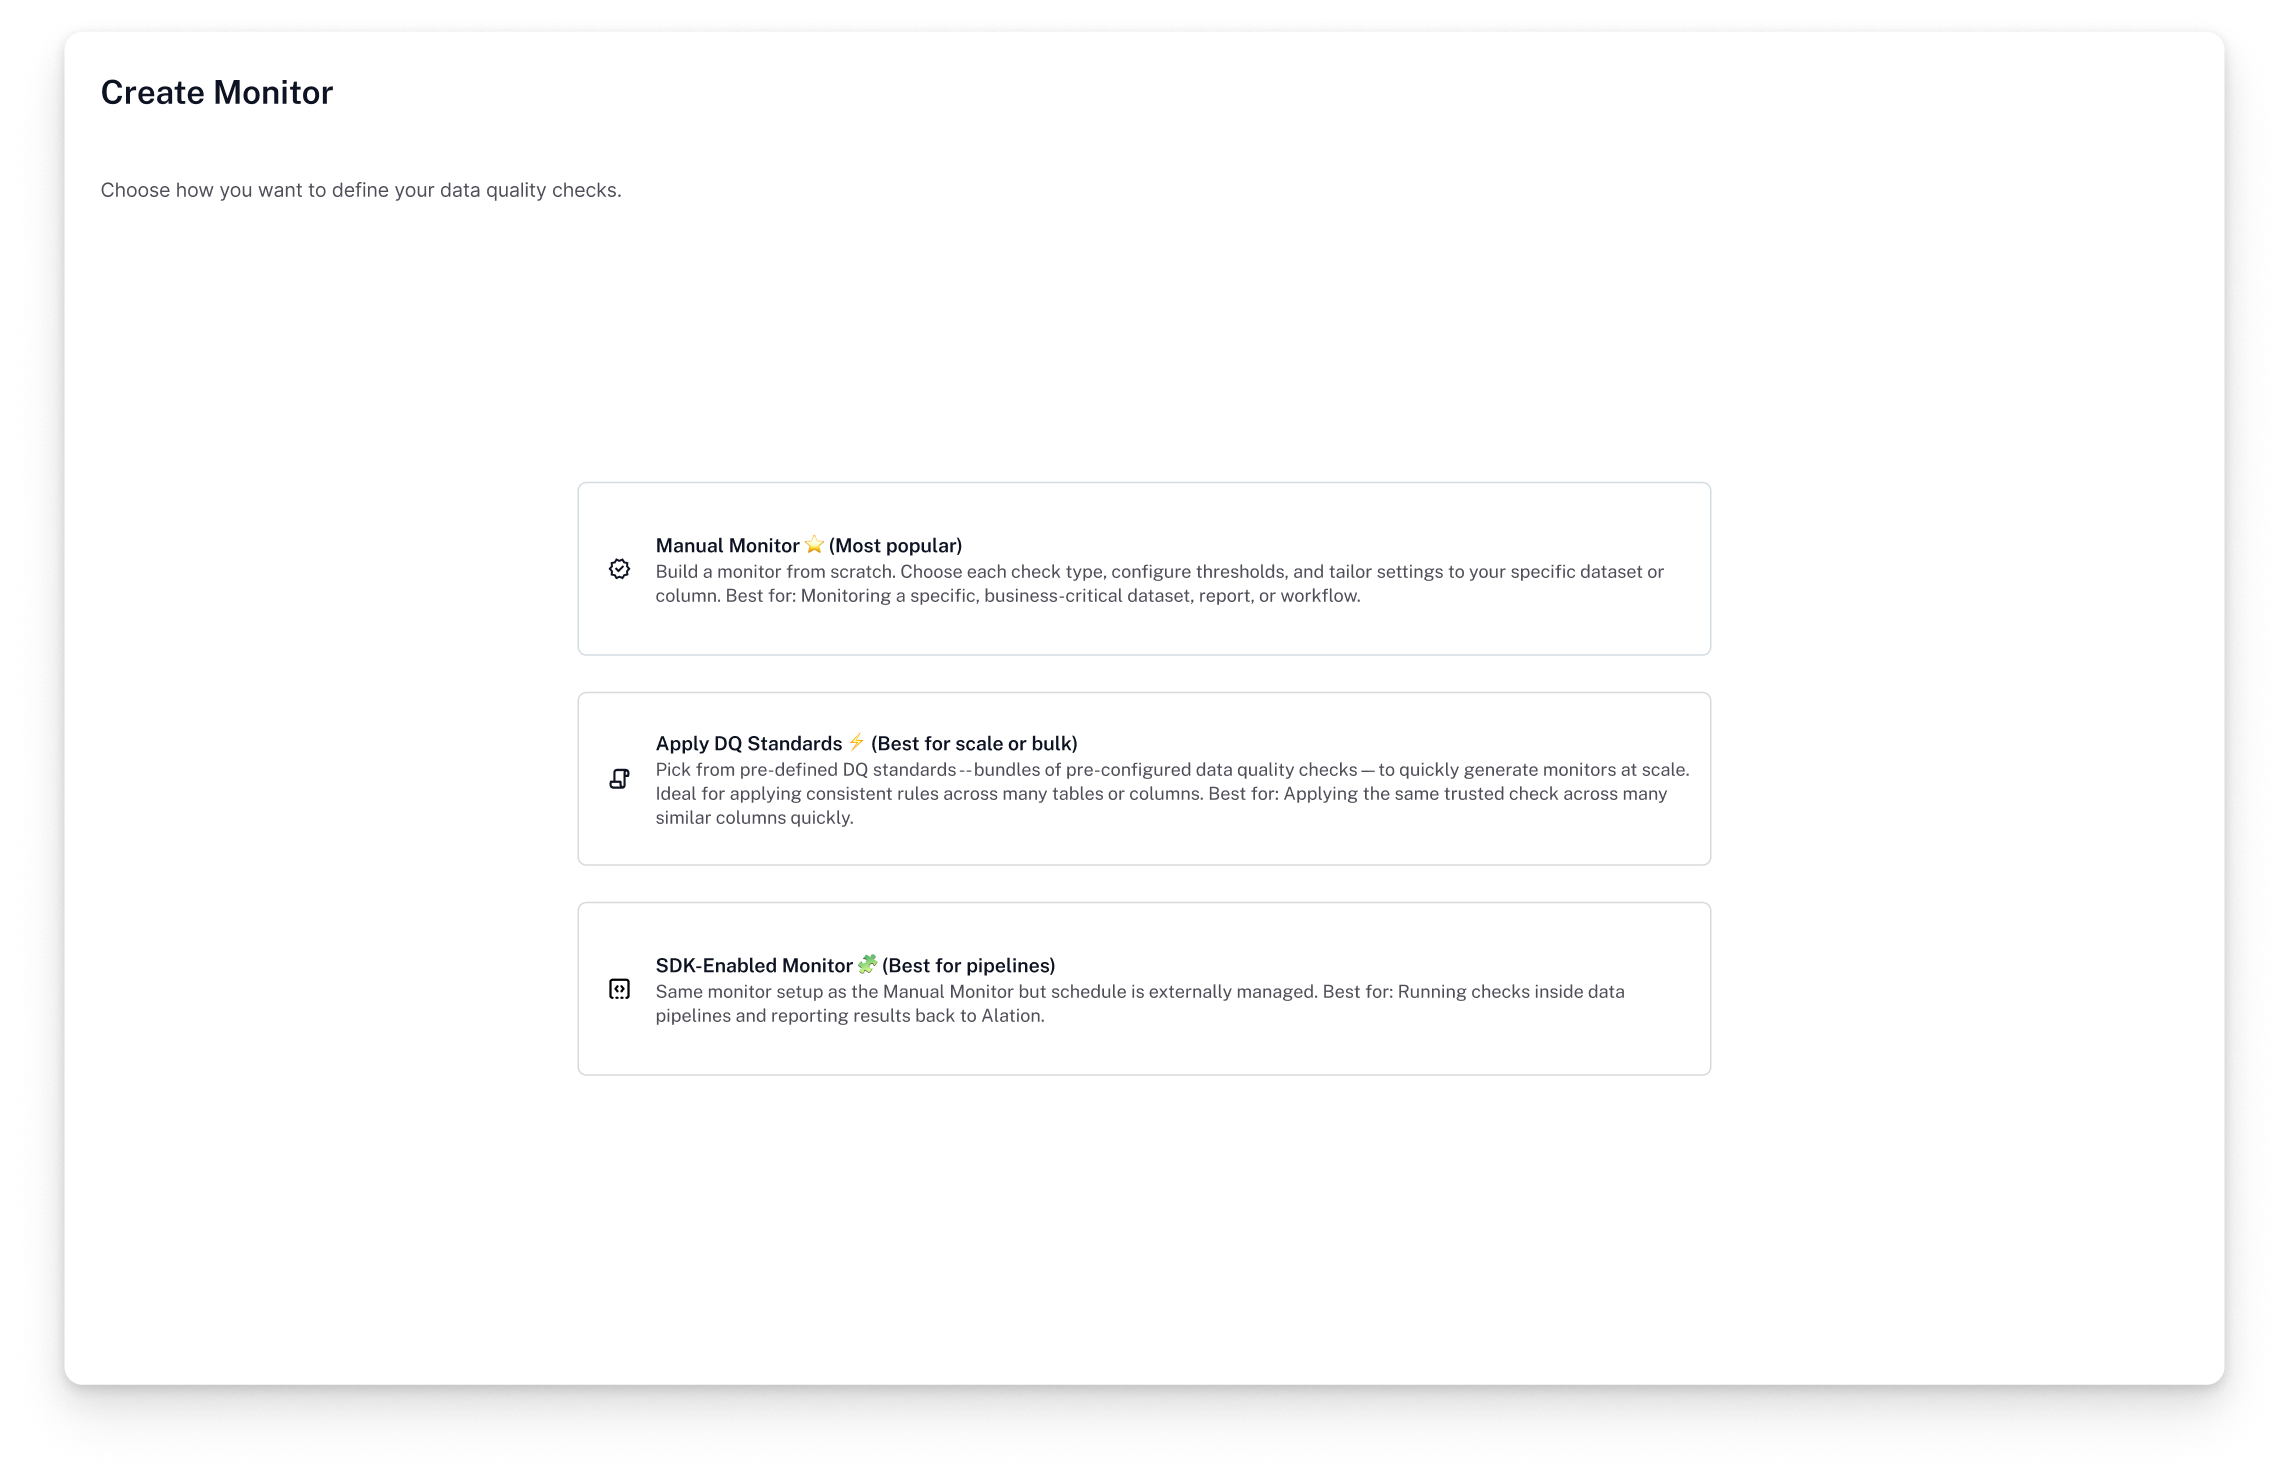
Select Type of Monitor
Expanded monitors to include ‘standard / template-based’ as well as SDK-enabled, where the monitors are ‘managed’ externally.
-
![]()
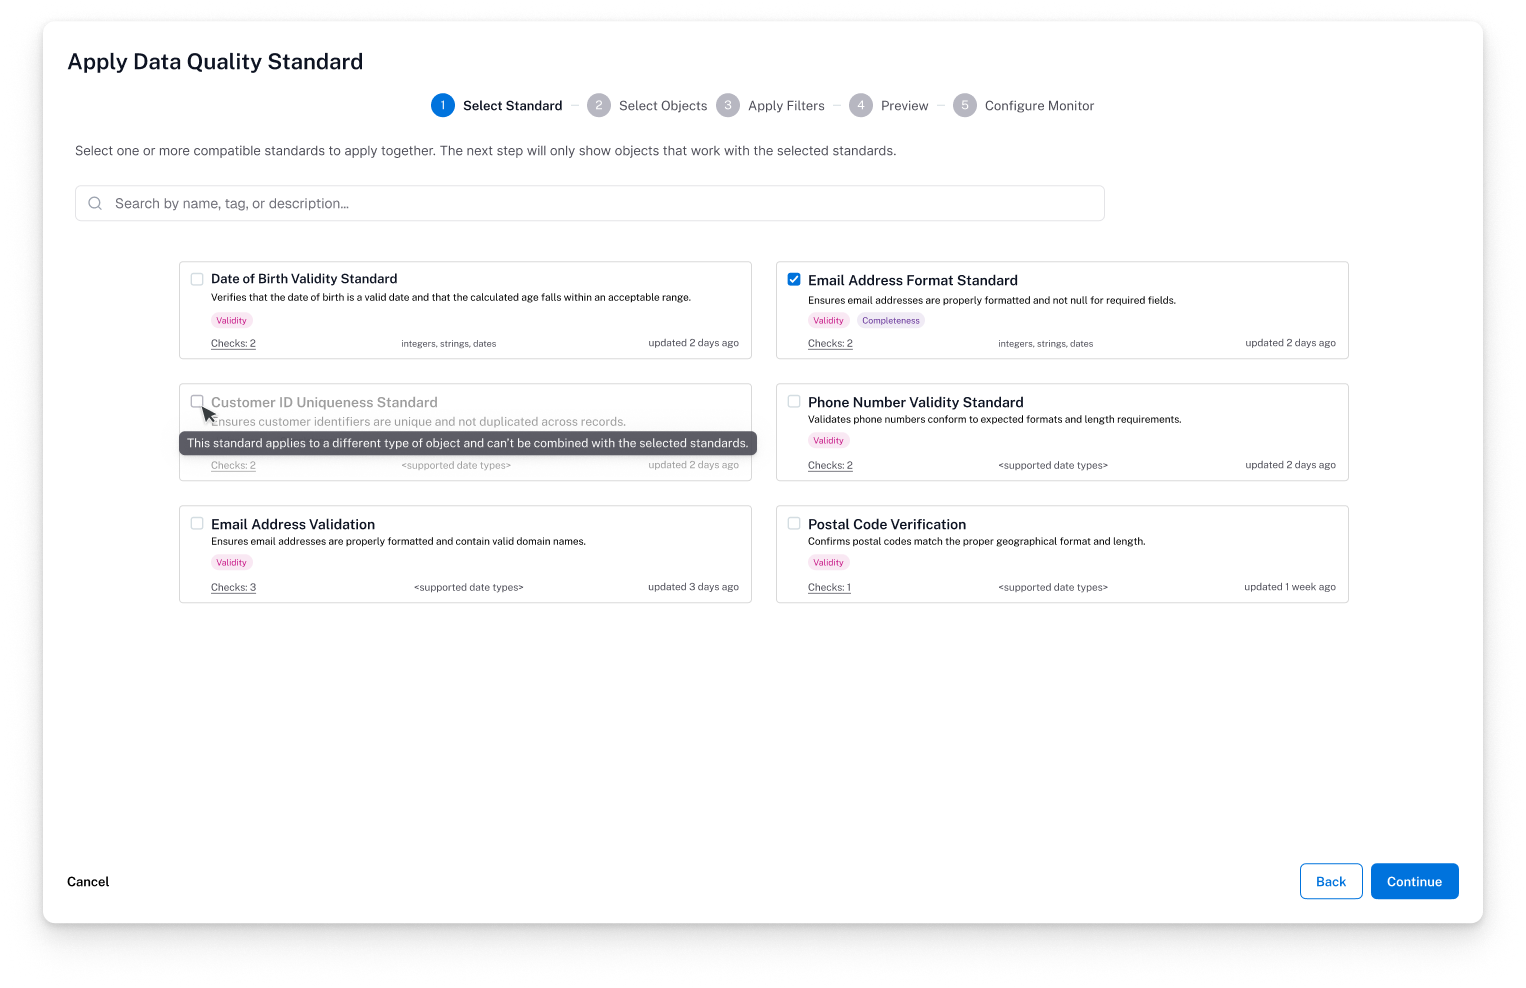
Selecting Standard
Showcasing the compatibility check for standards selection. Some checks are not compatible for specific data types, so conflicting check types cannot be in the same standard monitor.
-
![]()
Object Search Empty State
Providing an empty state with tips on how to get started / what to search for.
-
![]()
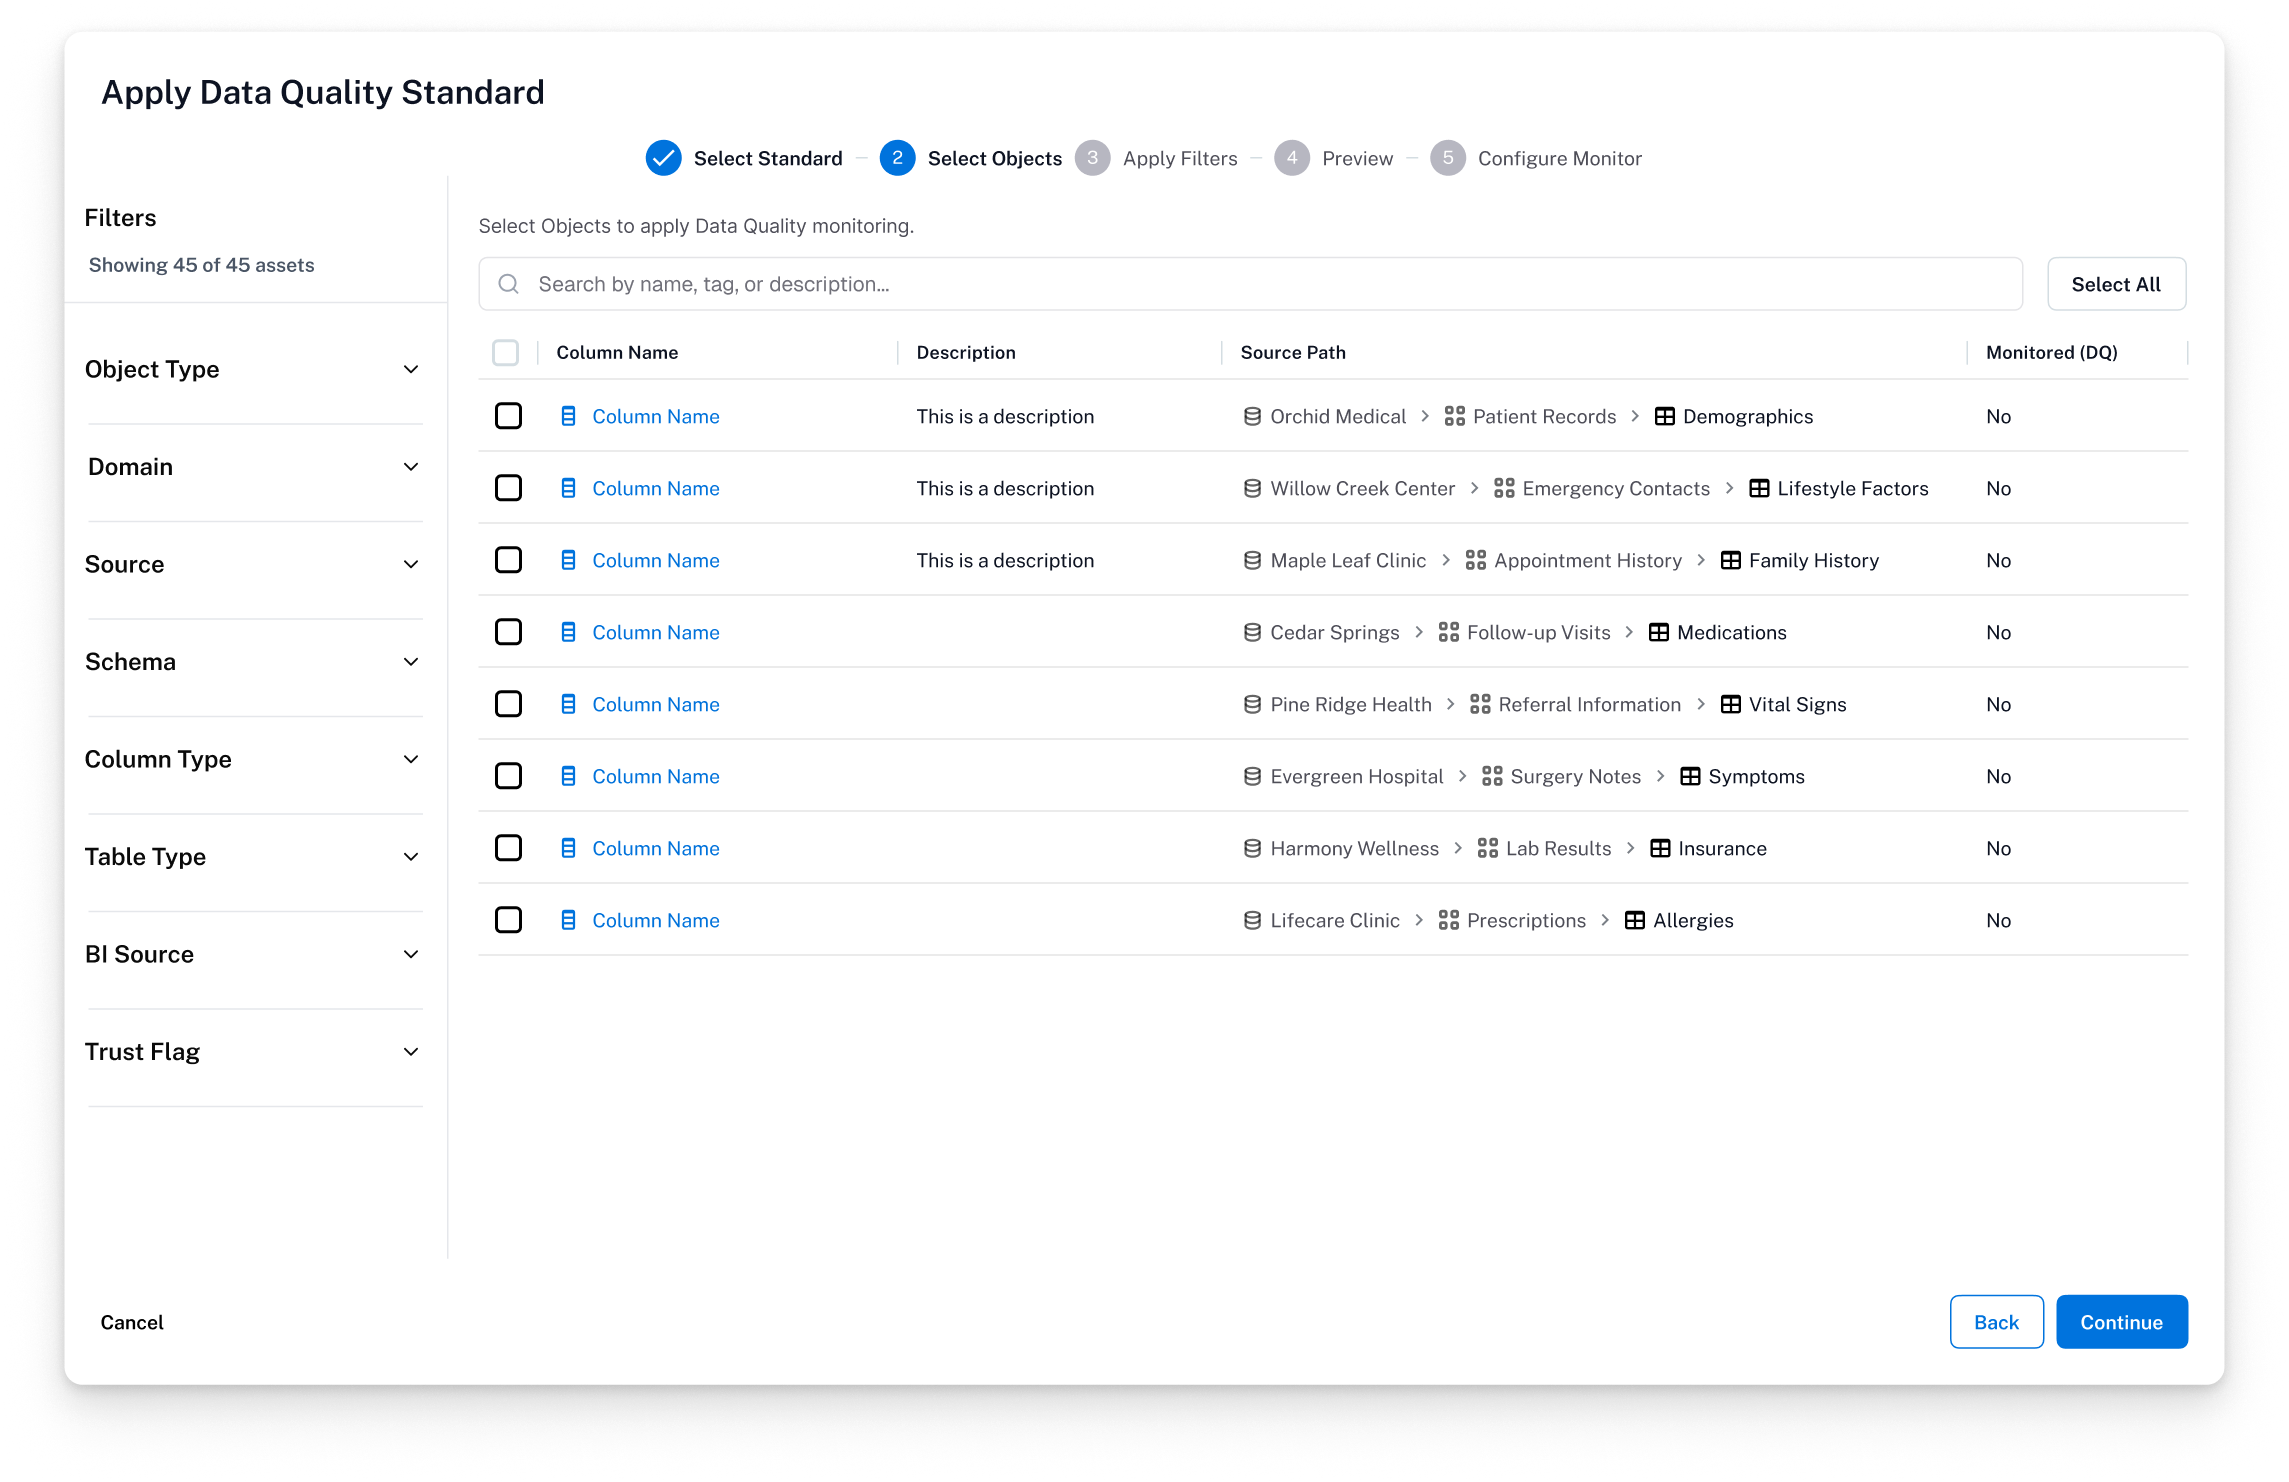
Search Results
Search uses the same filters and components as the global catalog search experience, leveraging familiarity of the feature.
-
![]()
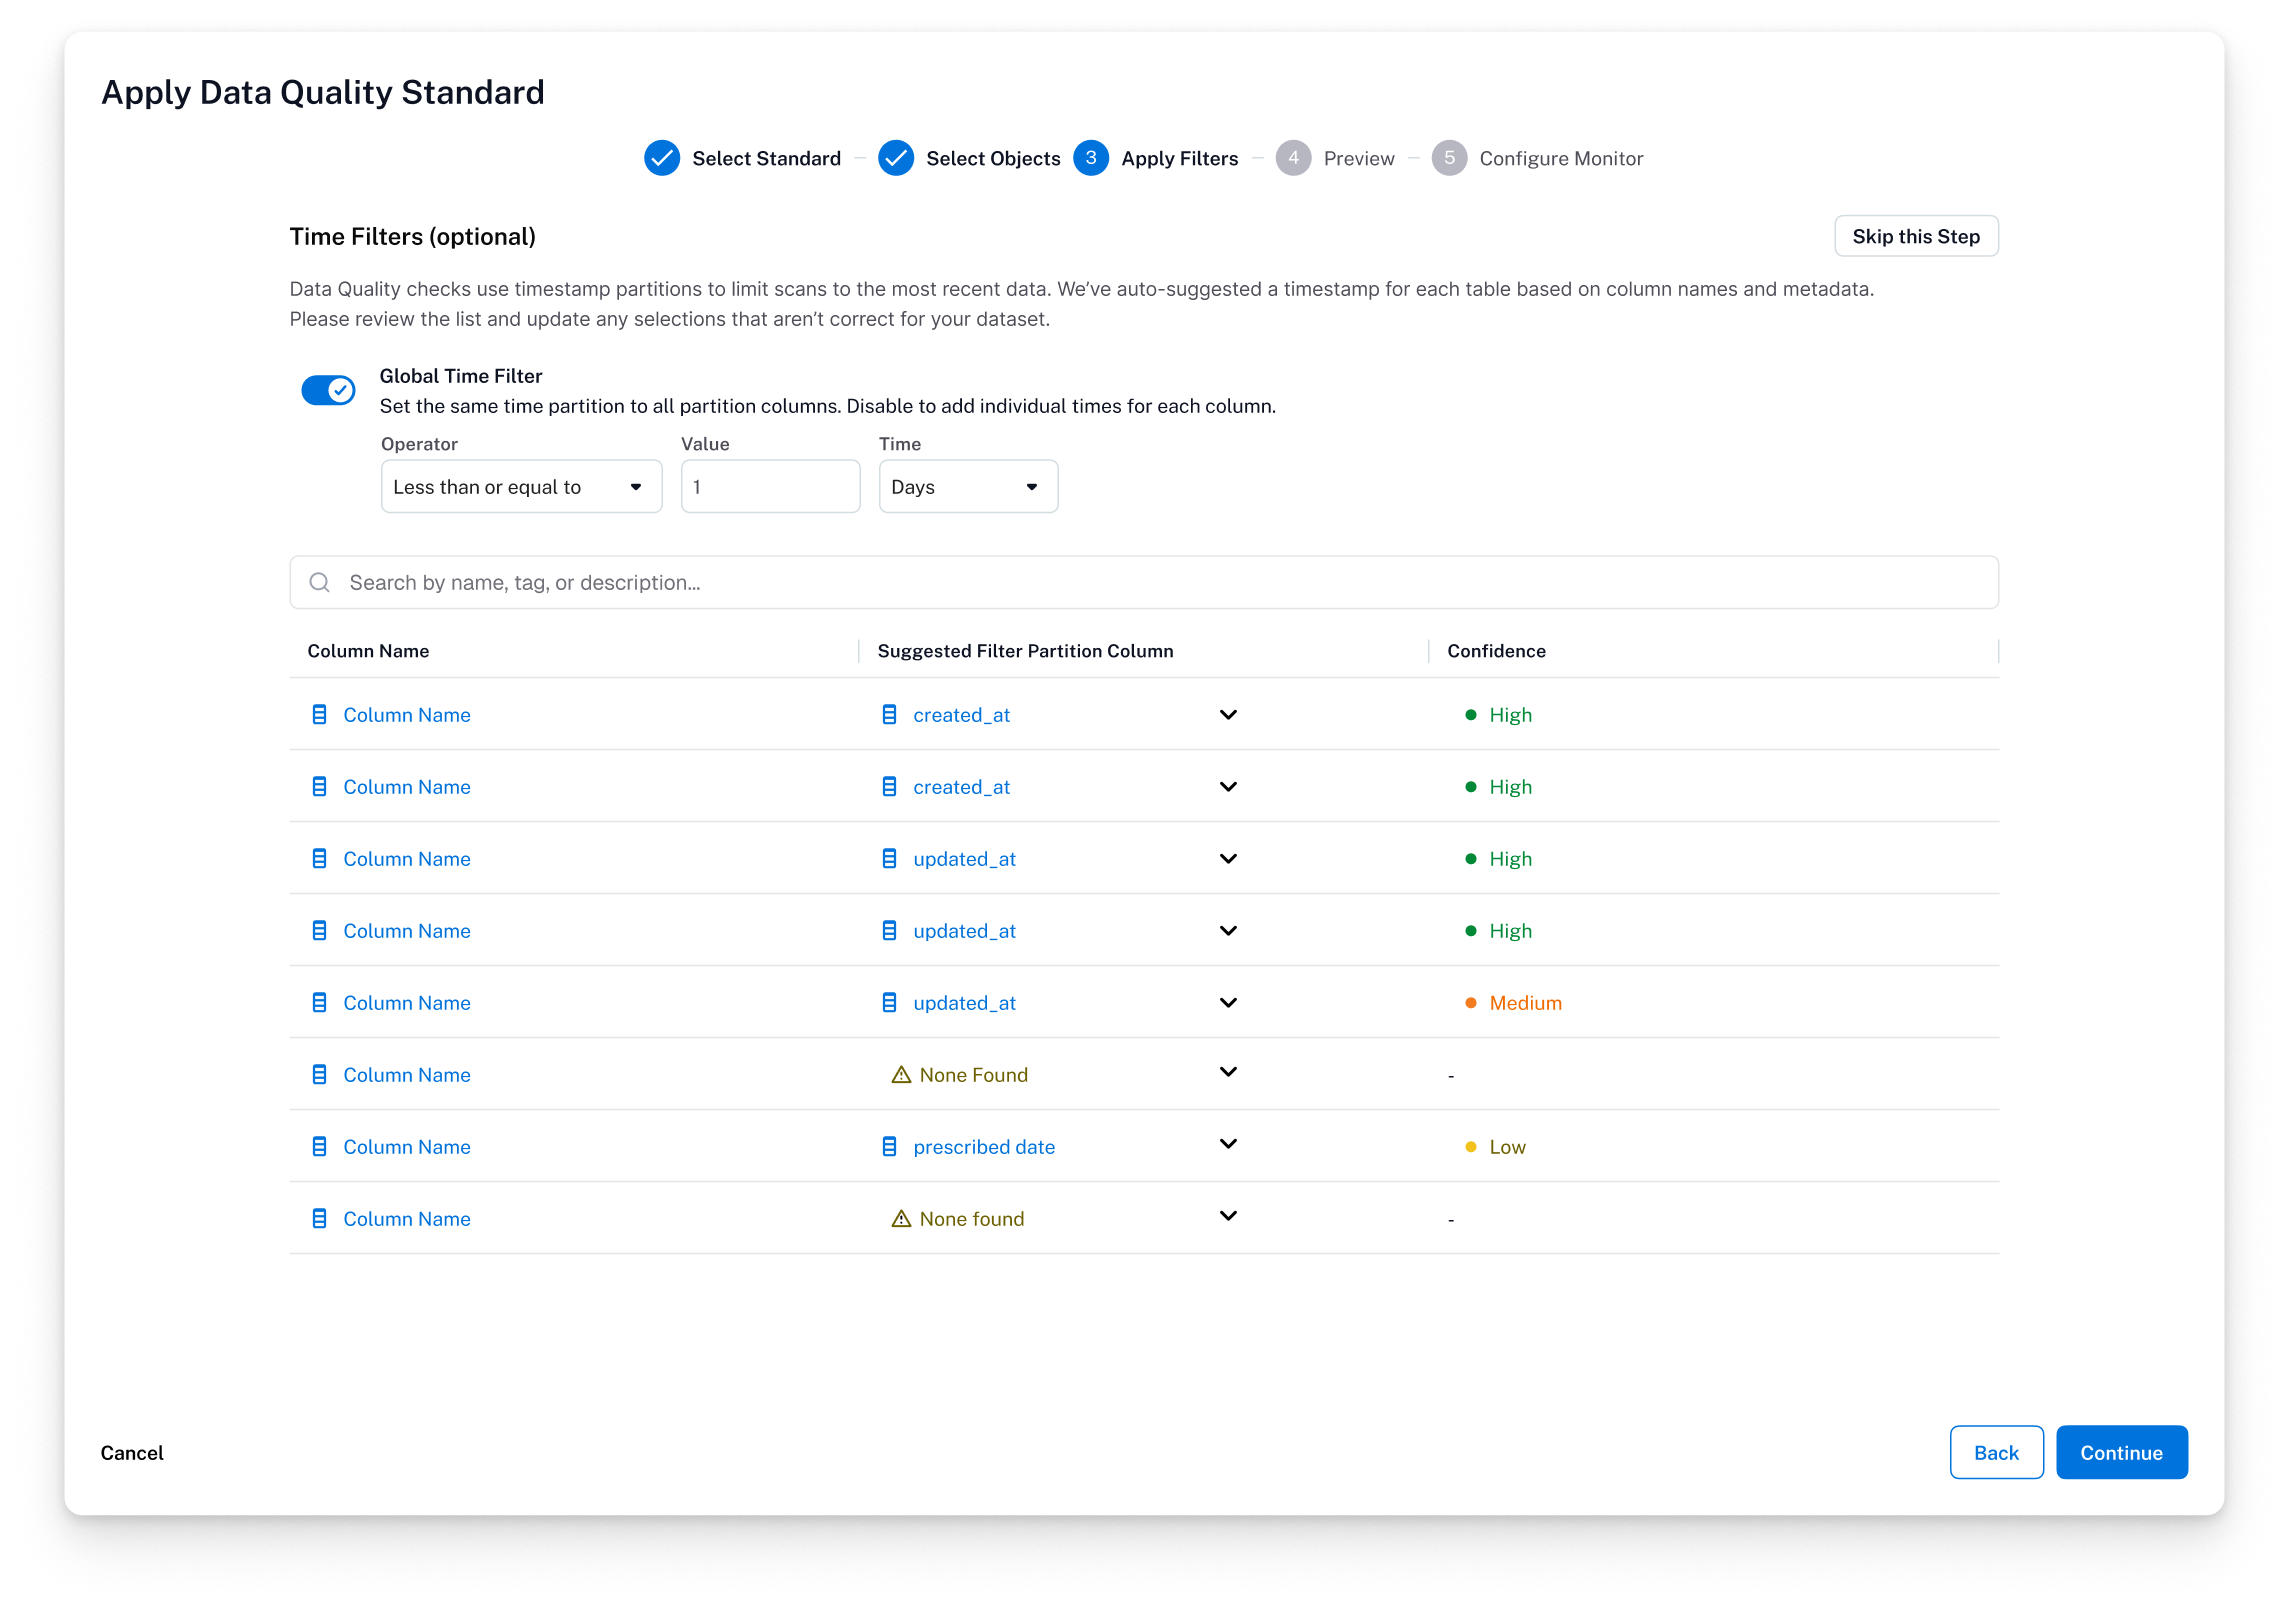
Time-partitioning
Data quality checks can be taxing on performance if there is a high volume of data / rows. Added a global time-based partition (can be set individually as well) to easily section off data by time.
-
![]()
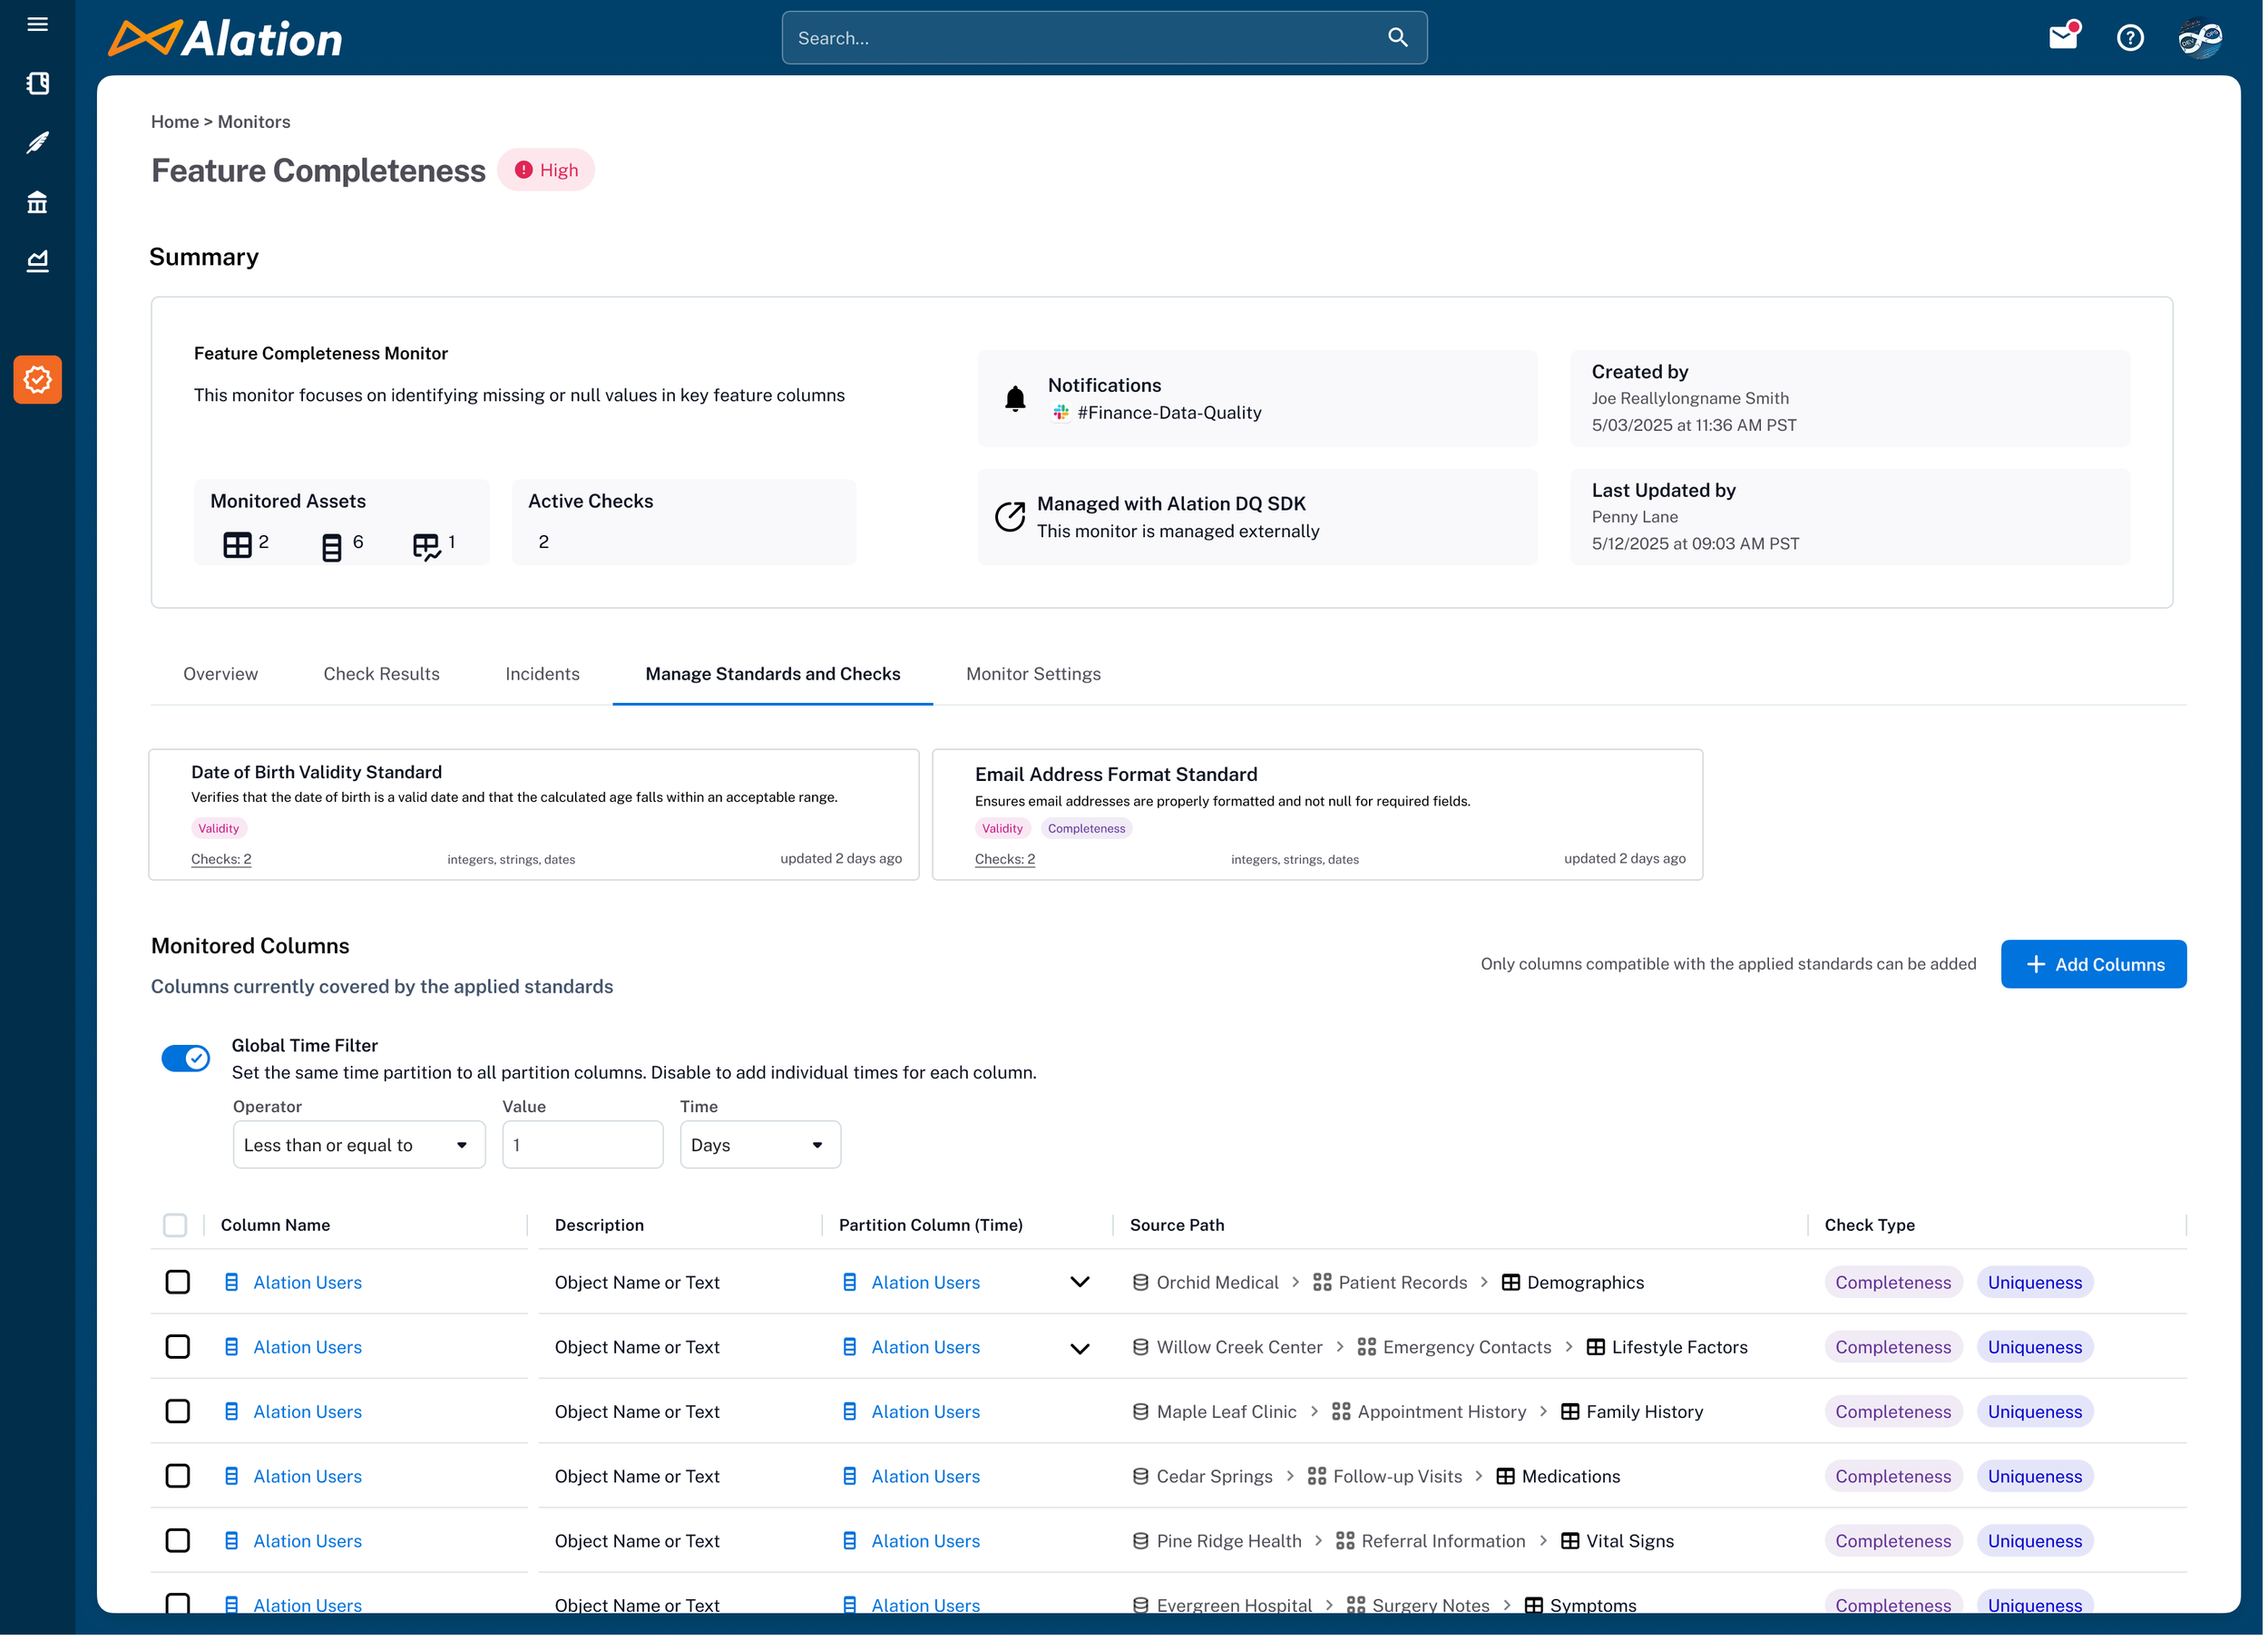
Standard Monitor Page
Showcasing the monitor page that was built on standards. Note, anomalies cannot be added to a standard-based monitor.
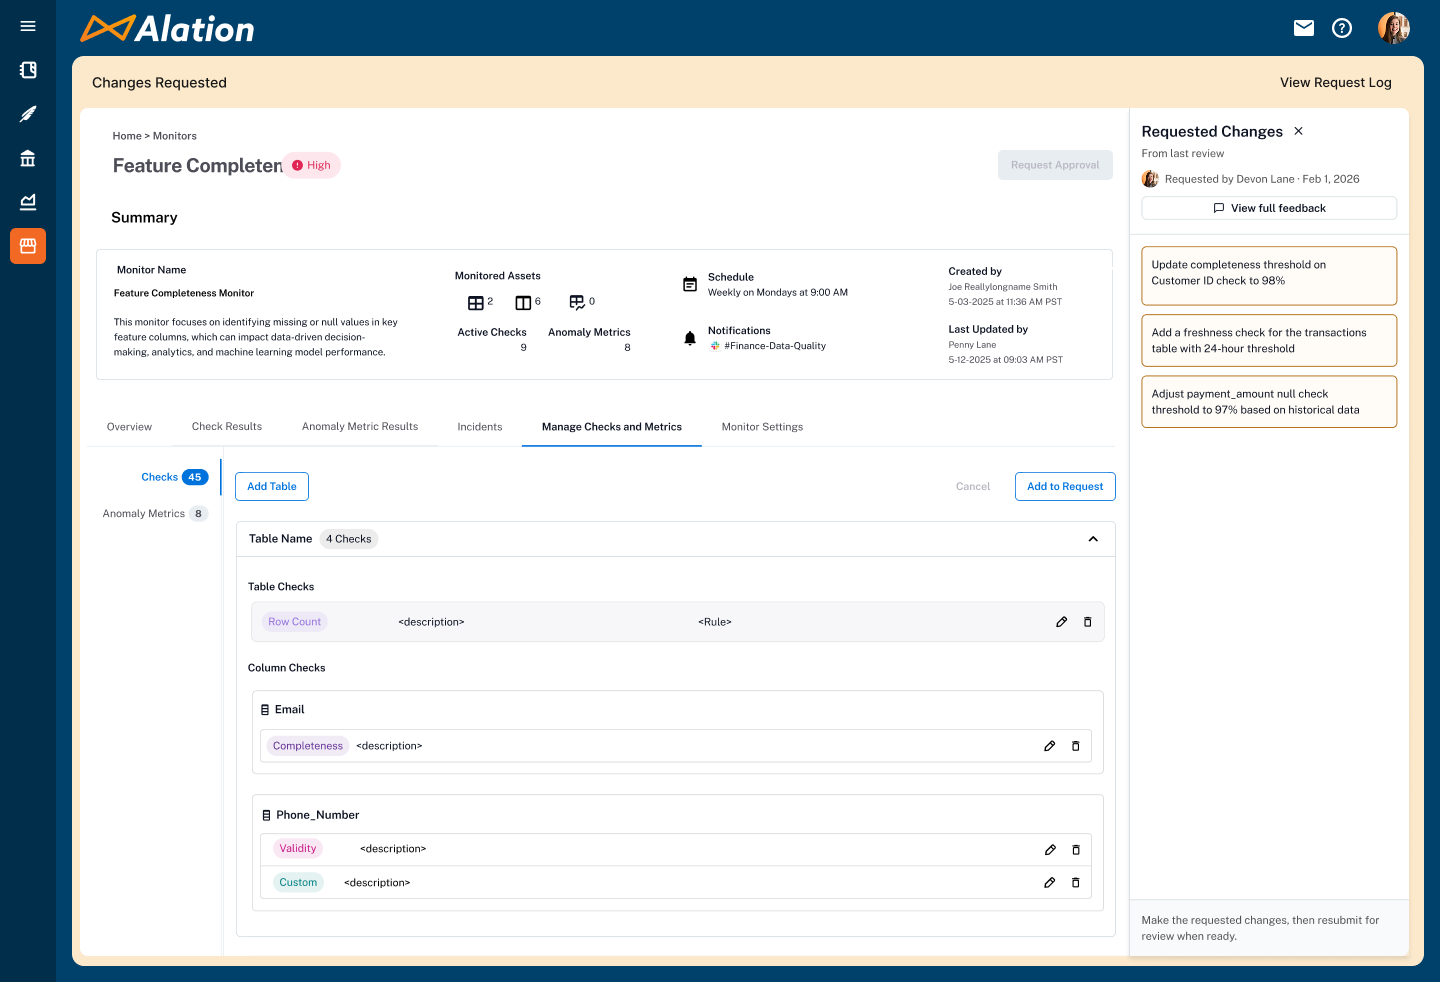
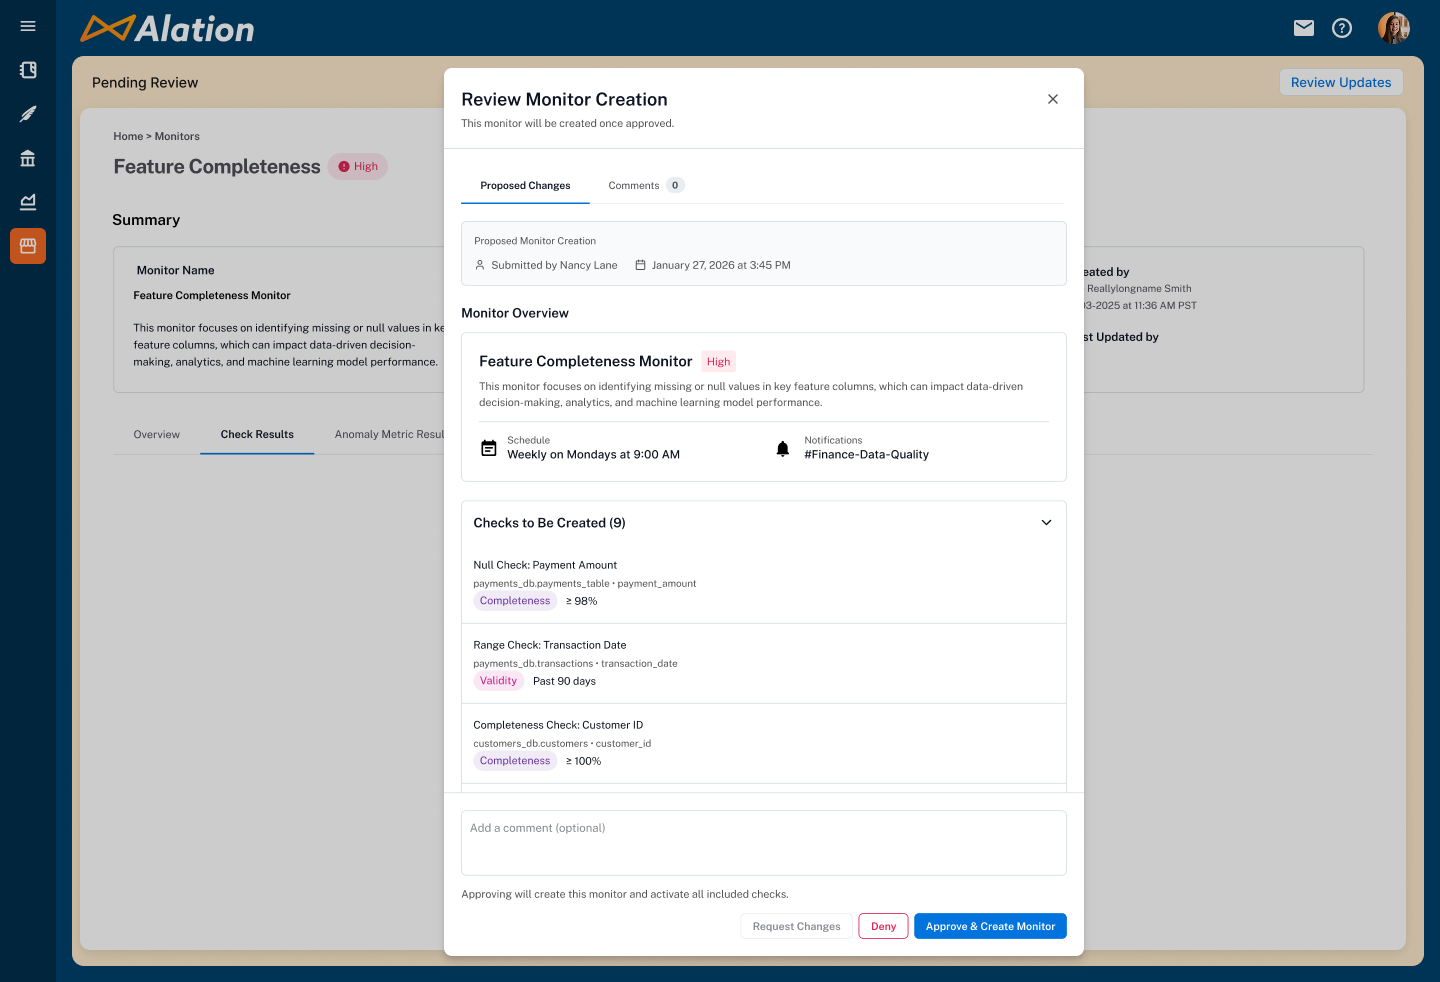
Approval Workflows — Governance for the Governance Tool
Customers didn't wait for the problem to happen — they told us upfront that without a gatekeeping mechanism, monitors would inevitably be created at will, leading to duplicates, poorly scoped checks, and low-value rules that generate noise and drive up cost (every check and anomaly detection run has a computational price tag). They wanted a guardrail before scaling adoption, not a cleanup tool after the fact.
I had designed approval workflows at LaunchDarkly for feature flag rollouts, so I came in knowing the common pitfalls: flows that block velocity by making approvals slow, ambiguous states that leave users unsure whether their change is live, and the critical mistake of locking the production artifact while a review is in progress. That experience directly shaped how I approached this.
I designed a five-state approval flow: request creation or changes, approve and apply, deny, request changes before approval, and resubmit after revisions. The critical architectural decision was how to handle the live monitor during review. A pending approval request never blocks the active monitor — requested changes open a working copy while the original continues running on schedule. Once approved, the copy merges back into the live version. This meant teams could maintain review rigor without disrupting active monitoring or creating gaps in coverage.
Approval workflows ensured monitors were purpose-built rather than created impulsively — reducing duplicates, eliminating non-useful checks, and keeping computational costs under control. It also gave data stewards the organizational trust they needed to scale monitor creation across teams, knowing that every monitor had been reviewed before it started consuming resources.
Impact and Results
| Outcome | Detail |
|---|---|
| $2M+ ARR | Achieved within six months of launch, validating demand for a unified, catalog-native approach to data quality. |
| Competitive Wins | The monitor-as-hub model, dual entry points, and embedded AI recommendations were cited by Sales as decisive differentiators in evaluations against Monte Carlo, Bigeye, and Soda. |
| Team Growth | Mentored a junior designer to full ownership of key feature areas — dashboard redesign and query cost/runtime visibility — scaling the team's design capacity alongside the product. |
| Allie Award | Peer-nominated design excellence recognition across Alation's product organization. |
What I Carried Forward
The system model is the design work.
Getting the conceptual architecture right meant every downstream screen and flow had coherent logic to fall back on.
Sequencing is a design decision.
Shipping Monitors first let users build the tacit knowledge that made Standards land.
Mentorship multiplies impact.
Giving a junior designer genuine ownership expanded the team's capacity and produced better work than I could have delivered alone.
AI tooling changes leverage, not judgment.
Faster exploration meant more informed ideas in every conversation. Rigor still came from ‘jobs to be done’, user research, and hard debates.
Trust is the product.
Every decision, from Preview States to human-in-the-loop AI, was in service of earning and maintaining user trust.